


FXOpen
In the realm of technical analysis, identifying and interpreting candlestick patterns is a fundamental skill for traders. Among these, bullish and bearish counterattack lines are notable for their potential to signal market reversals. Understanding their signals can enhance a trader’s ability to make informed decisions and optimise their trading strategies.
In this article, you will learn how to identify counterattack lines, read their signals, and implement them in your trading.
Counterattack Lines: An Overview
Bullish and bearish counterattack lines are candlestick patterns that signal a possible change in a market direction. They can be spotted on any timeframe but mostly occur on daily and weekly charts. Moreover, both formations can be found in currency pairs, cryptocurrencies*, stocks, commodities, and ETFs.
Bullish Counterattack Lines
The bullish counterattack candlestick pattern is a crucial tool for traders to identify potential reversals from a bearish to a bullish trend. In the bullish pattern, the price of the asset initially trends downwards. This is followed by a gap down. After that, a bull counterattack follows, and the trend turns upward.
Characteristics of the Bullish Counterattack Pattern
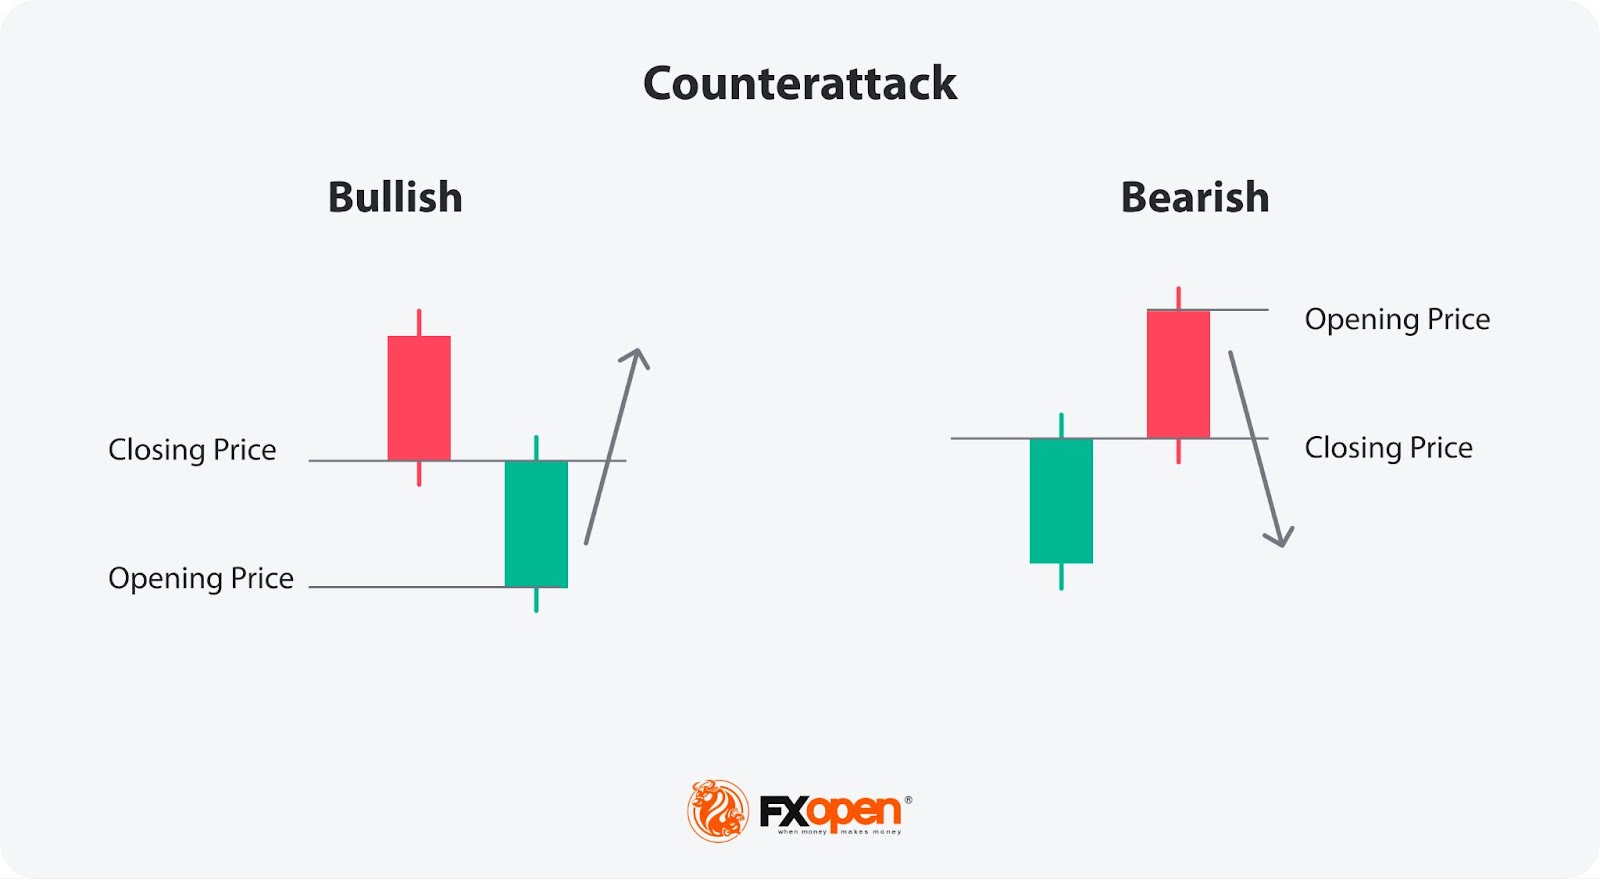
The pattern is composed of two candles.
- First Candle: The first candle is long and bearish, reflecting substantial selling pressure.
- Second Candle: The second candlestick opens lower, continuing the bearish sentiment, but closes near the previous candle's close, showing a strong bullish counterattack.
- The Gap: The price gap occurs when the bearish candlestick closes at a price level significantly higher than the opening of the bullish candlestick.
Bearish Counterattack Lines
The bearish counterattack line mirrors its bullish counterpart and is equally effective at identifying potential trend reversals, but from a bullish to a bearish direction. It also consists of two candles and highlights a shift in market sentiment.
The asset initially trends upwards. The uptrend eventually reaches its peak, and a bear counterattack occurs, leading to a downtrend.
Characteristics of the Bearish Counterattack Pattern
- First Candle: The first candle is long and bullish, reflecting strong buying pressure.
- Second Candle: The second candlestick opens higher, continuing the uptrend, but closes near the previous candle's close, indicating a strong bearish counterattack.
- The Gap: Just like with the bullish counterattack, a price gap is formed. The price gap results from the bullish candlestick closing at a price level significantly lower than the opening of the bearish candlestick.
Understanding the Bullish Counterattack Strategy
The psychology behind the bullish counterattack strategy is to identify the end of the bearish movement. The market starts on a bearish note; however, as time elapses, the bears run out of momentum. This decline in bearish volume is followed by a swift switch from a downtrend to an uptrend.
Trading the Bullish Counterattack Candlestick Pattern
Traders usually use these steps to trade bullish counterattack lines:
- Identification: The first step is to spot the candlestick formation at the end of a downtrend – look for a long, bearish candle followed by a bullish candle that gaps down but closes near the previous one's close.
- Confirmation: It is important to confirm the pattern with additional technical indicators. These could include moving averages or other momentum indicators. For instance, a moving average cross from beneath to the upside may be taken as a confirmation signal.
- Entry Point: Once the pattern is confirmed, traders may open a long position just above the high of the first candle. This entry point signifies that the uptrend is likely to continue.
- Stop Loss: To potentially manage risk, traders might place a stop loss just below the low of the second candle. This precaution might help mitigate potential losses if the market does not move as anticipated. In the more conservative strategy, a trader could use a risk/reward ratio to identify a stop-loss level.
- Take Profit: Traders usually use resistance levels, moving averages, or other technical indicators to determine when to take profit. As the price approaches a resistance level or supply zone, traders consider it as an option to close the trade. A moving average cross from the top can also indicate that the uptrend has reached its peak. Thus, traders decide to close a long position at this point.
Following these steps, a trader might leverage the bullish counterattack pattern to make informed trading decisions and take advantage of potential market reversals.
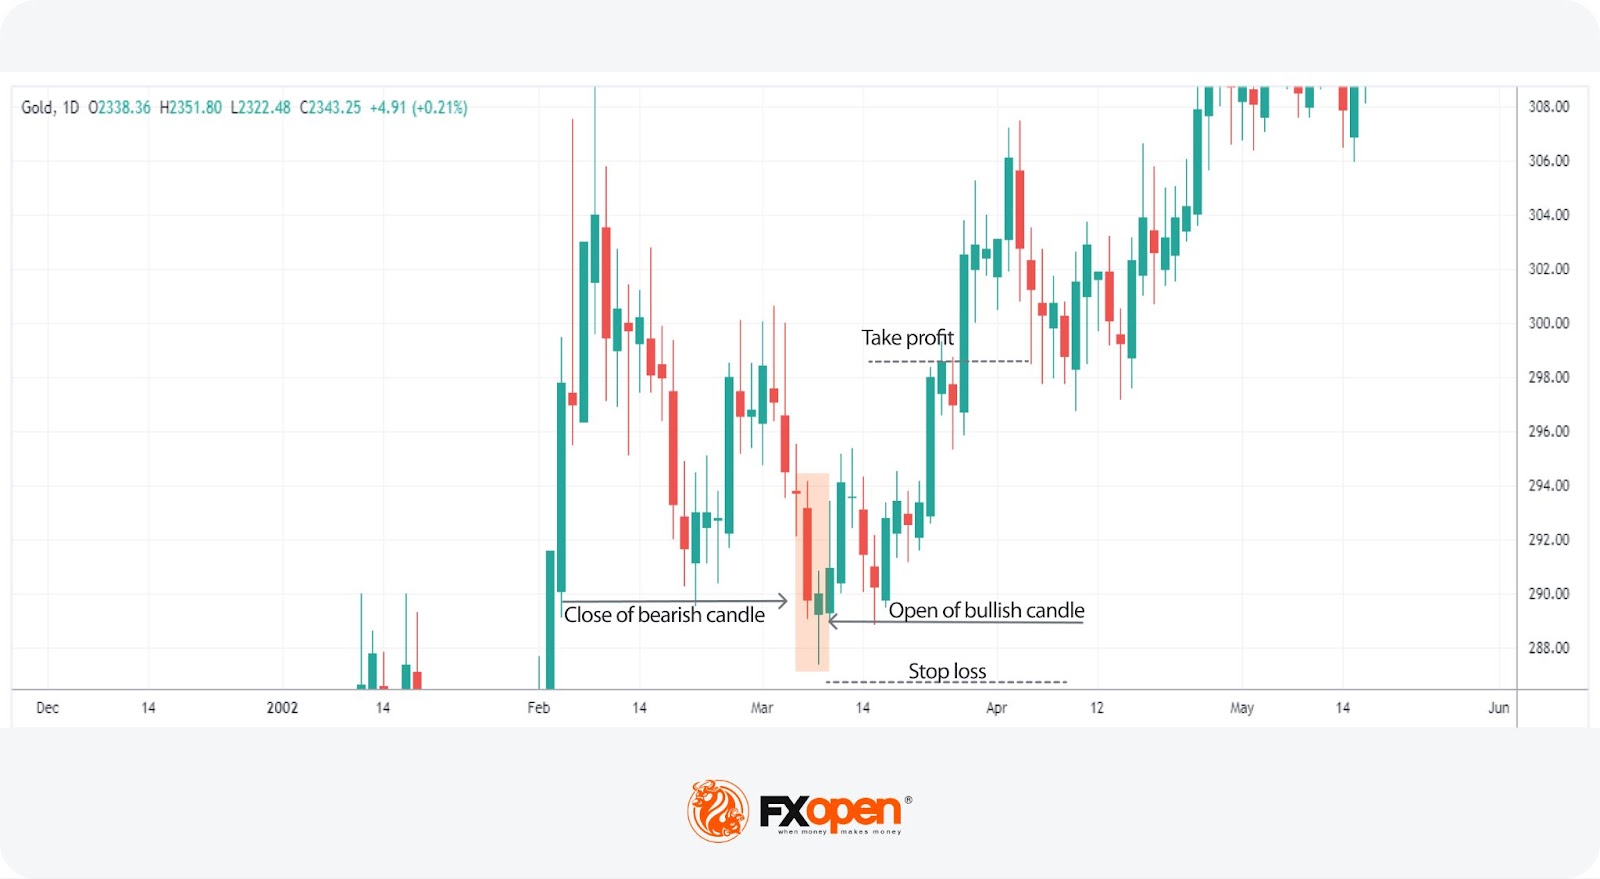
Real-Life Example
The chart below shows the price movement of Gold against the US dollar on a daily timeframe. The second candle opens lower, continuing the bearish sentiment, but closes near the previous one's close, showing a strong bullish counterattack. A trader places a stop-loss order below the second candle’s low to potentially limit losses and sets a take-profit order at the closest resistance level. A trader might use a trailing take-profit order and move the profit target to the next resistance level.
Understanding the Bearish Counterattack Strategy
The bearish counterattack pattern forms when an uptrend reaches its peak. This indicates that buyers have run out of fuel, and the sellers have placed huge sell orders that could drive the asset price downwards.
Trading the Bearish Counterattack Candlestick Pattern
According to the theory, traders follow these steps when applying the bearish counterattack pattern:
- Identification: Traders spot the pattern at the end of an uptrend – look for a long bullish candle followed by a bearish candle that gaps up but closes near the previous one's close.
- Confirmation: Traders usually confirm the formation with additional technical indicators, such as a lower close of the next candle, resistance levels, or momentum indicators.
- Entry Point: Traders may enter a short position below the low of the first candle. This entry point indicates that the bearish momentum may continue.
- Stop Loss: According to the theory, a stop-loss level might be placed above the high of the second candle to potentially manage risk. This measure might protect against potential losses if the market moves contrary to expectations.
- Exit Strategy: Traders usually use support levels or technical indicators like moving averages to determine the exit point. This approach potentially ensures that they secure returns as the market moves in their favour.
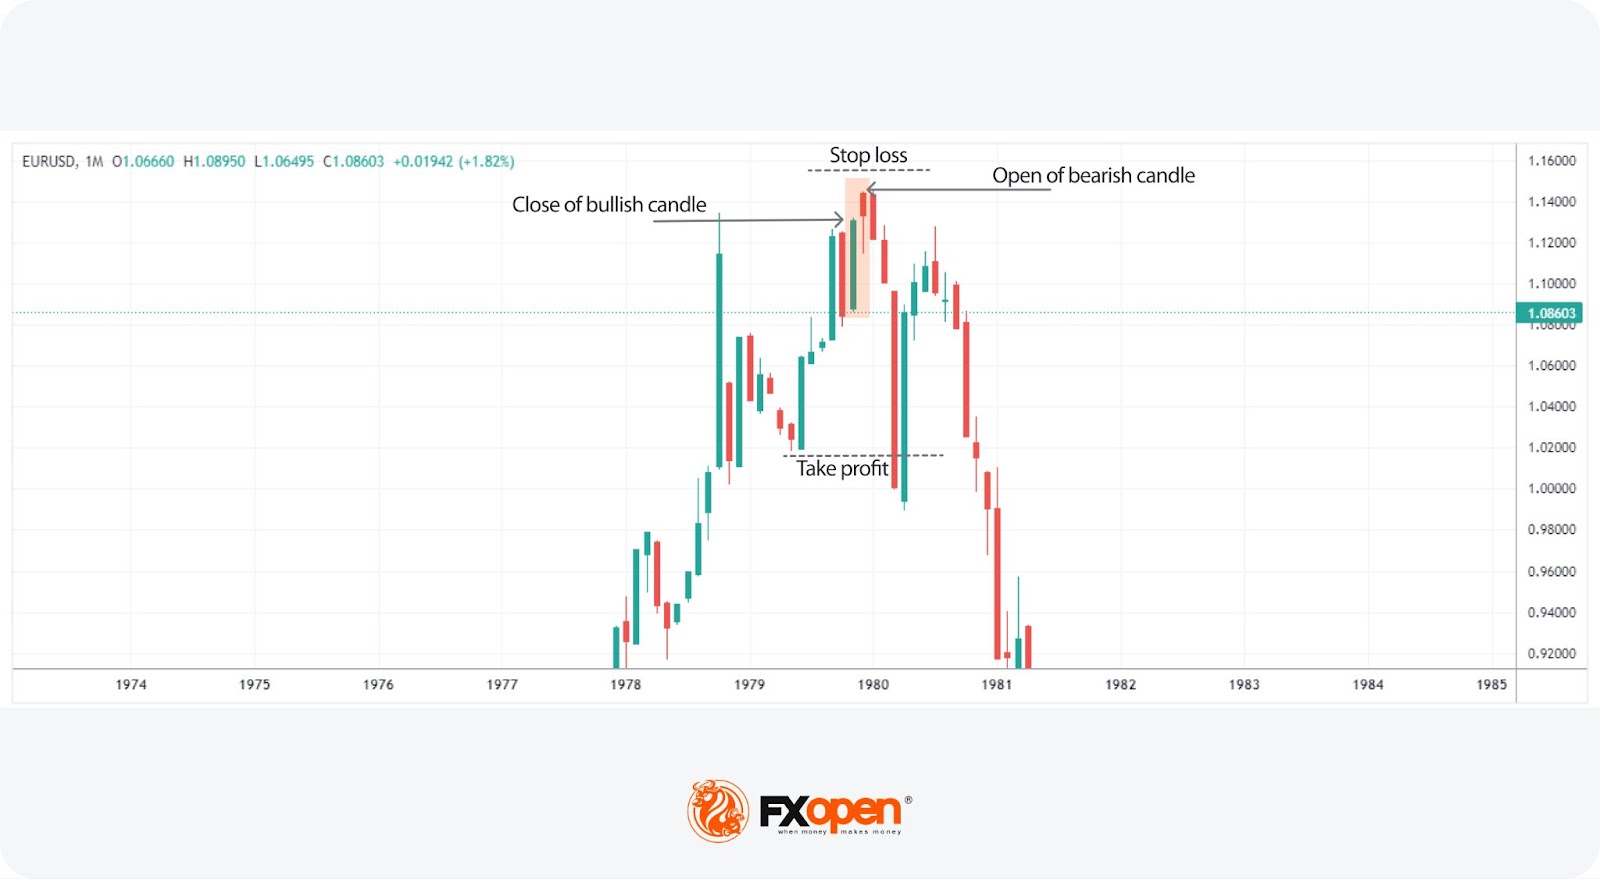
Real-Life Example
The chart below depicts a real-life example of a bearish counterattack reversal formed within an uptrend in the EURUSD chart. The second candle opens higher, continuing the bullish sentiment, but closes near the previous candle's close, showing a strong bearish counterattack. A trader places a stop-loss level above the high of the bearish candlestick and sets a take-profit target at the closest swing low.
By following these steps, a trader can make informed trading decisions and potentially take advantage of market reversals.
Advantages of the Bullish and Bearish Counterattack Pattern
The bullish and bearish counterattack patterns have the following advantages:
- Relatively High Efficiency Ratio: Counterattack lines can be very effective when identifying trend reversals.
- Versatility: The strategy can be applied across various markets, including forex, stocks, indices, and commodities, enhancing its utility for traders.
- Complementary to Other Tools: The formations can be used in conjunction with other technical analysis tools, such as moving averages, support and resistance levels, and momentum indicators, to confirm signals and improve accuracy.
Limitations of the Bullish and Bearish Counterattack Patterns
Despite their advantages, counterattack lines have limitations that traders need to be aware of:
- False Signals: No technical analysis tool is perfect. Like every other pattern, the counterattack lines may provide false signals, leading to potential losses.
- Market Context: The effectiveness of these patterns can vary depending on the broader market context. When using counterattack lines, traders need to consider other factors, such as overall market trends and news events.
- Complexity: Identifying and interpreting these formations correctly requires experience and a deep understanding of technical analysis. Novice traders may find it difficult to implement these formations in their strategies.
To potentially mitigate these limitations, counterattack lines are usually used in conjunction with other technical analysis indicators like Volumes, the MACD, and the Relative Strength Index. These indicators, alongside 1,200+ trading tools, can be found in FXOpen’s TickTrader platform.
Counterattack Lines vs On-Neck Pattern
These patterns look similar but provide different signals.
- Counterattack Lines: This is a reversal pattern, signalling a potential change in the market trend. It consists of a long candle in the direction of the prevailing trend followed by a second long candle that opens in the same direction but closes near the previous one's close.
- On-Neck: This is a continuation pattern, indicating that the current downtrend will likely continue. It occurs when a bearish candle is followed by a smaller bullish candle that gaps down but closes near or at the bearish candle's close.
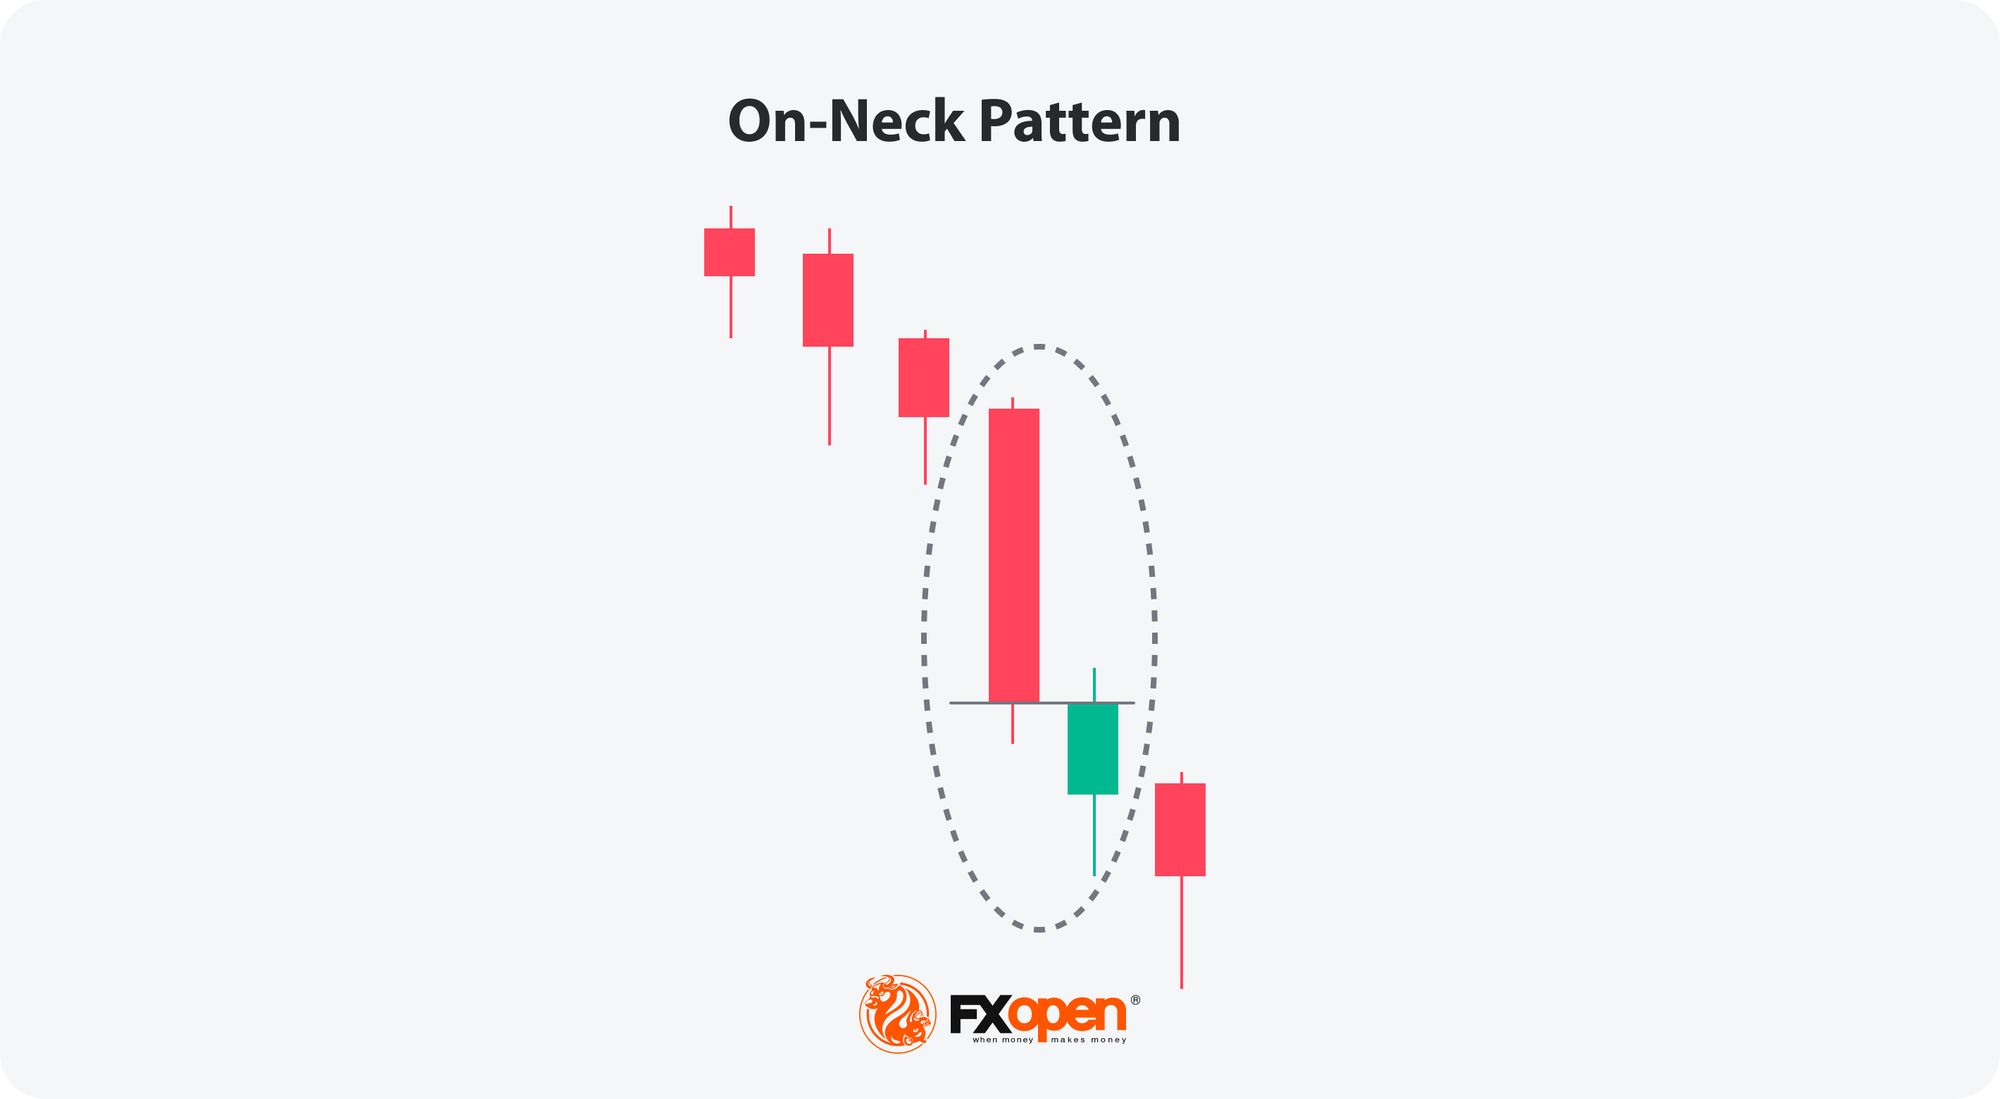
Unlike the counterattack lines, the second candle is usually small and reflects weak bullish volume. The weak bullish volume cannot trigger a change in market direction; hence, the trend continues. This formation is called "on-neck" because the closing prices of both candles align closely, forming a horizontal line that resembles a neckline.
The Bottom Line
Bullish and bearish counterattack lines are trend reversal patterns. Just like a literal counterattack in warfare or sports indicates a speedy shift in attacking dominance from one troop or team to another, both patterns indicate a swift change in bull-bear dominance.
Both patterns are valuable for traders seeking to pinpoint major trend reversals. When used with other indicators and thorough market analysis, they can help you make strategic decisions on when to enter or exit trades, potentially enhancing trading results.
Traders keen on exploring the counterattack trading strategy can open an FXOpen account to access over 600 markets and more than 1,200 trading tools.
FAQs
What Is the Counterattack Line Candlestick Pattern?
The counterattack line is a pattern indicating a potential change in market sentiment. It consists of a long candle in the direction of the prevailing trend followed by a second long candle that opens in the same direction but closes near the previous candle's close, signalling a counterattack by the opposing market force. It is used to identify price reversals in various markets, including forex, stocks, indices, and commodities.
What Is a Bullish Reversal Pattern?
A bullish reversal pattern is a candlestick pattern that signals the potential end of a downtrend and the beginning of an uptrend. Examples include the bullish counterattack lines, hammer, and morning star. These patterns indicate increasing buying pressure and a shift in market sentiment from bearish to bullish, providing traders with opportunities to enter long positions.
*At FXOpen UK and FXOpen AU, Cryptocurrency CFDs are only available for trading by those clients categorised as Professional clients under FCA Rules and Professional clients under ASIC Rules, respectively. They are not available for trading by Retail clients.
This article represents the opinion of the Companies operating under the FXOpen brand only. It is not to be construed as an offer, solicitation, or recommendation with respect to products and services provided by the Companies operating under the FXOpen brand, nor is it to be considered financial advice.
Stay ahead of the market!
Subscribe now to our mailing list and receive the latest market news and insights delivered directly to your inbox.


Latest articles


Market Insights with Gary Thomson: Oil, US Retail Sales & NFP in Focus
In this video, we’ll explore the key economic events and market trends, shaping the financial landscape. Get ready for insights into financial markets to help you navigate the week ahead. Let’s dive in!
In this episode of Market

Geopolitics Fuels Volatility: AUD/USD and USD/CAD Near Key Levels
Commodity-linked currencies continue to weaken amid rising geopolitical tensions, which are boosting demand for safe-haven assets and increasing volatility across both FX and commodity markets. The US dollar is gaining support from demand for liquid and defensive assets, while currencies