


FXOpen
The ICT Turtle Soup is a trading pattern developed within the Inner Circle Trader (ICT) methodology. Built on principles of market psychology and liquidity hunting, this pattern is designed to exploit false breakouts around major support and resistance levels. It offers a way to anticipate reversals. In this article, we’ll break down what the Turtle Soup setup is, how it works, and the potential ways to integrate it into trading strategies.
The ICT Turtle Soup Pattern Explained
ICT Turtle Soup is a trading pattern developed by the Inner Circle Trader (ICT) that focuses on exploiting false breakouts in the market. This ICT price action strategy aims to identify and take advantage of situations where the price briefly moves beyond a major support or resistance level, only to reverse direction shortly after. This movement is often seen in ranging markets where prices oscillate between established highs and lows.
The concept behind ICT Turtle Soup trading is rooted in the idea of liquidity hunts and market imbalances. When the price breaks out, it often triggers stop-loss orders set by other traders, creating a temporary imbalance. The ICT Turtle Soup strategy seeks to capitalise on this by entering trades in the opposite direction once the breakout fails and the price returns to its previous range.
The pattern is named humorously after the original Turtle Traders' strategy, which focuses on genuine breakouts. In contrast, ICT Turtle Soup takes advantage of these failed attempts, thus "making soup out of turtles" by transforming unproductive breakout attempts into trades.
Typically, traders look for specific signs of a false breakout, such as a price briefly moving above a recent high or below a recent low but failing to sustain the move. This strategy is typically used in conjunction with other ICT concepts, such as higher timeframe analysis and understanding of market structure.
Components of the ICT Turtle Soup Pattern
The ICT Turtle Soup setup includes the following components: order flow and market structure, liquidity, and internal versus external liquidity.
Order Flow and Market Structure
Order flow and market structure are critical in analysing the ICT Turtle Soup pattern. This involves observing price movements and traders' behaviour in different timeframes.
If you want to analyse higher and lower timeframe price movements, consider using FXOpen’s TickTrader platform.
Higher Timeframe Structure
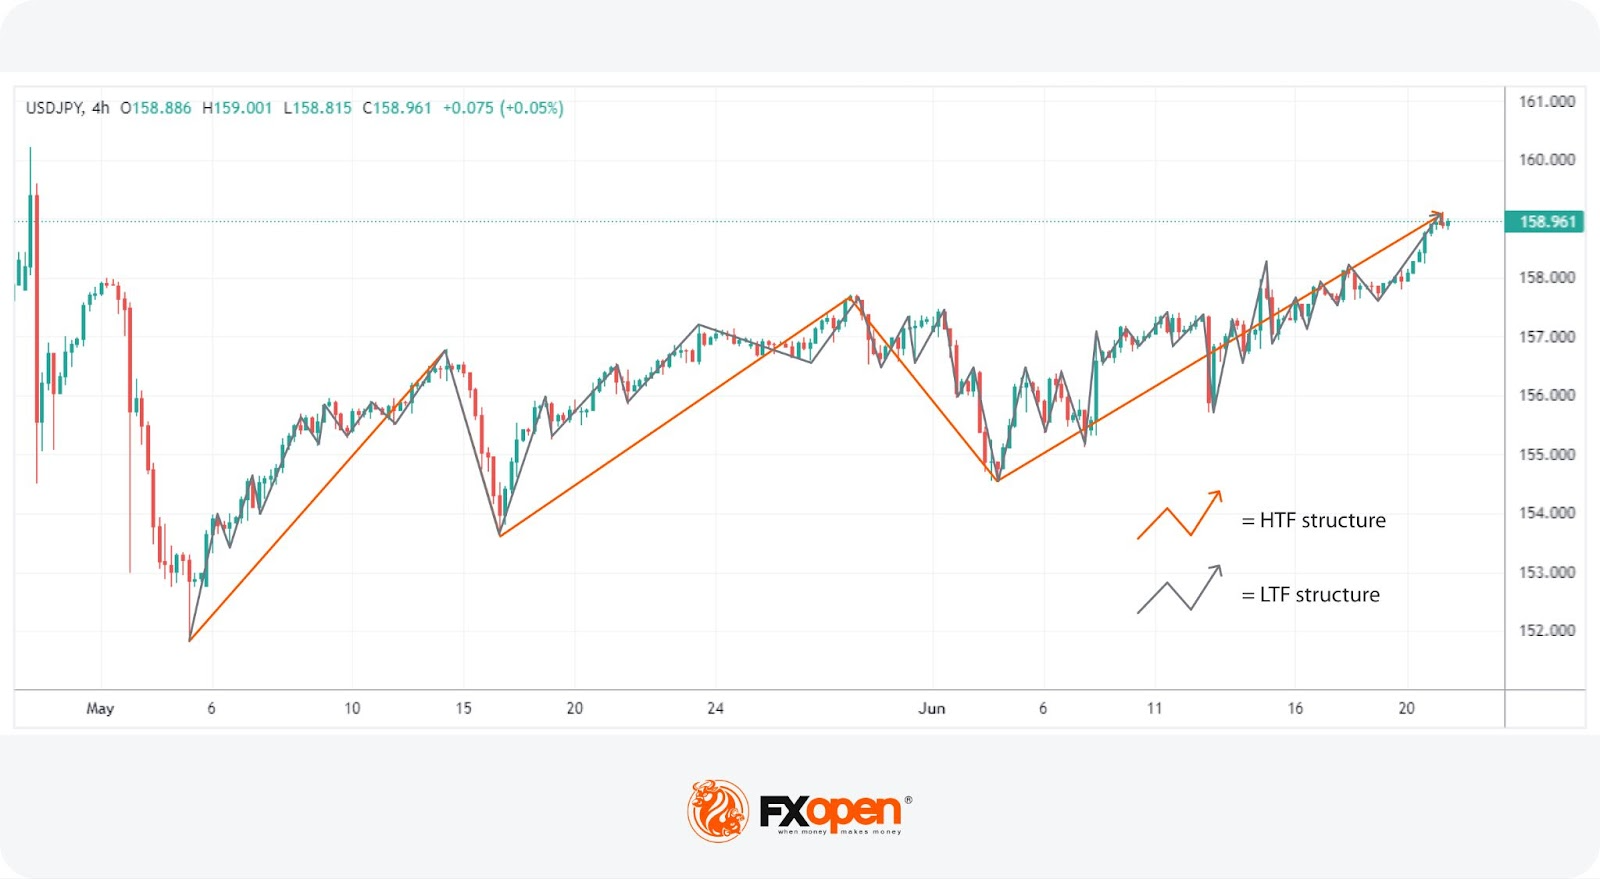
This refers to the broader trend governing the lower timeframe trend. For traders using the 15m-1h charts to trade, this might mean structure visible on 4-hour, daily, or weekly charts.
Higher timeframe structures may help traders identify the major support and resistance levels. These levels are essential as they mark the boundaries within which the market generally oscillates. Traders use these to determine the prevailing market direction and potential areas where false breakouts (stop hunts) are likely to occur.
Lower Timeframe Structure
Lower timeframe structures are examined on hourly or minute charts. These provide a more detailed view of price action within the higher timeframe’s range and account for the bullish and bearish legs that dictate a broader higher timeframe trend.
Liquidity and Stop Hunts
In general trading terms, liquidity represents how easy it is to enter or exit a market. However, in the context of the ICT Turtle Soup pattern, areas of liquidity can be identified beyond key swing points.
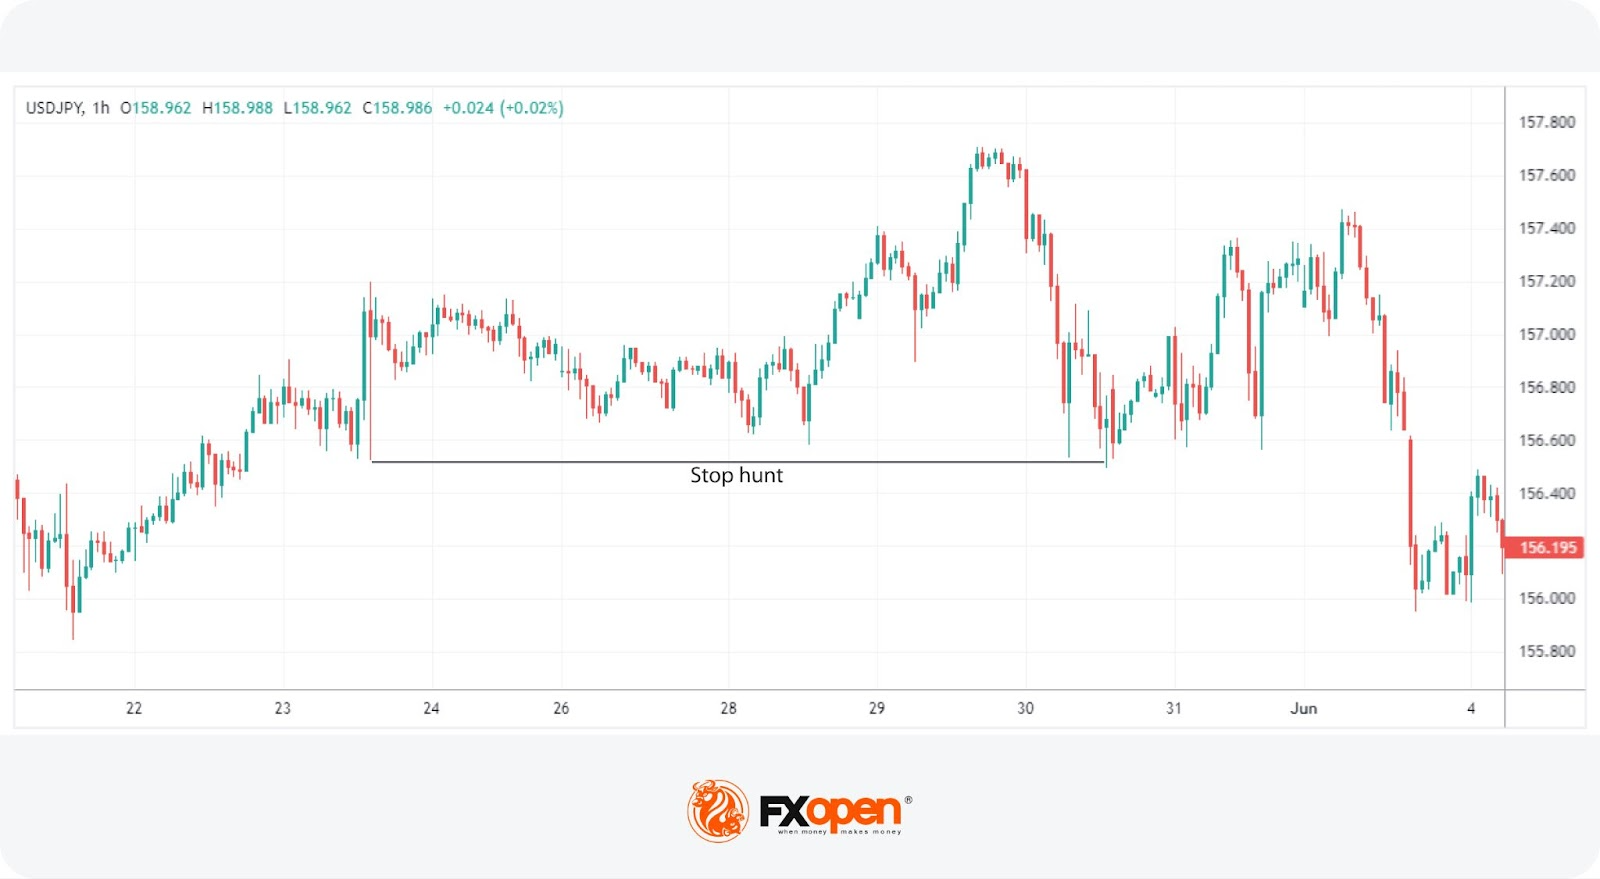
Stop Hunts
Stop hunts, also known as a liquidity sweep, occur when the price temporarily moves above a resistance level or below a support level to trigger stop-loss orders. This movement creates a liquidity spike as traders' stops are hit, providing a favourable condition for the price to reverse direction. ICT Turtle Soup traders seek to exploit these moments by entering trades opposite to the initial breakout direction once the liquidity is absorbed.
Internal and External Liquidity
Understanding internal and external liquidity is vital for applying the ICT Turtle Soup pattern.
Internal Liquidity
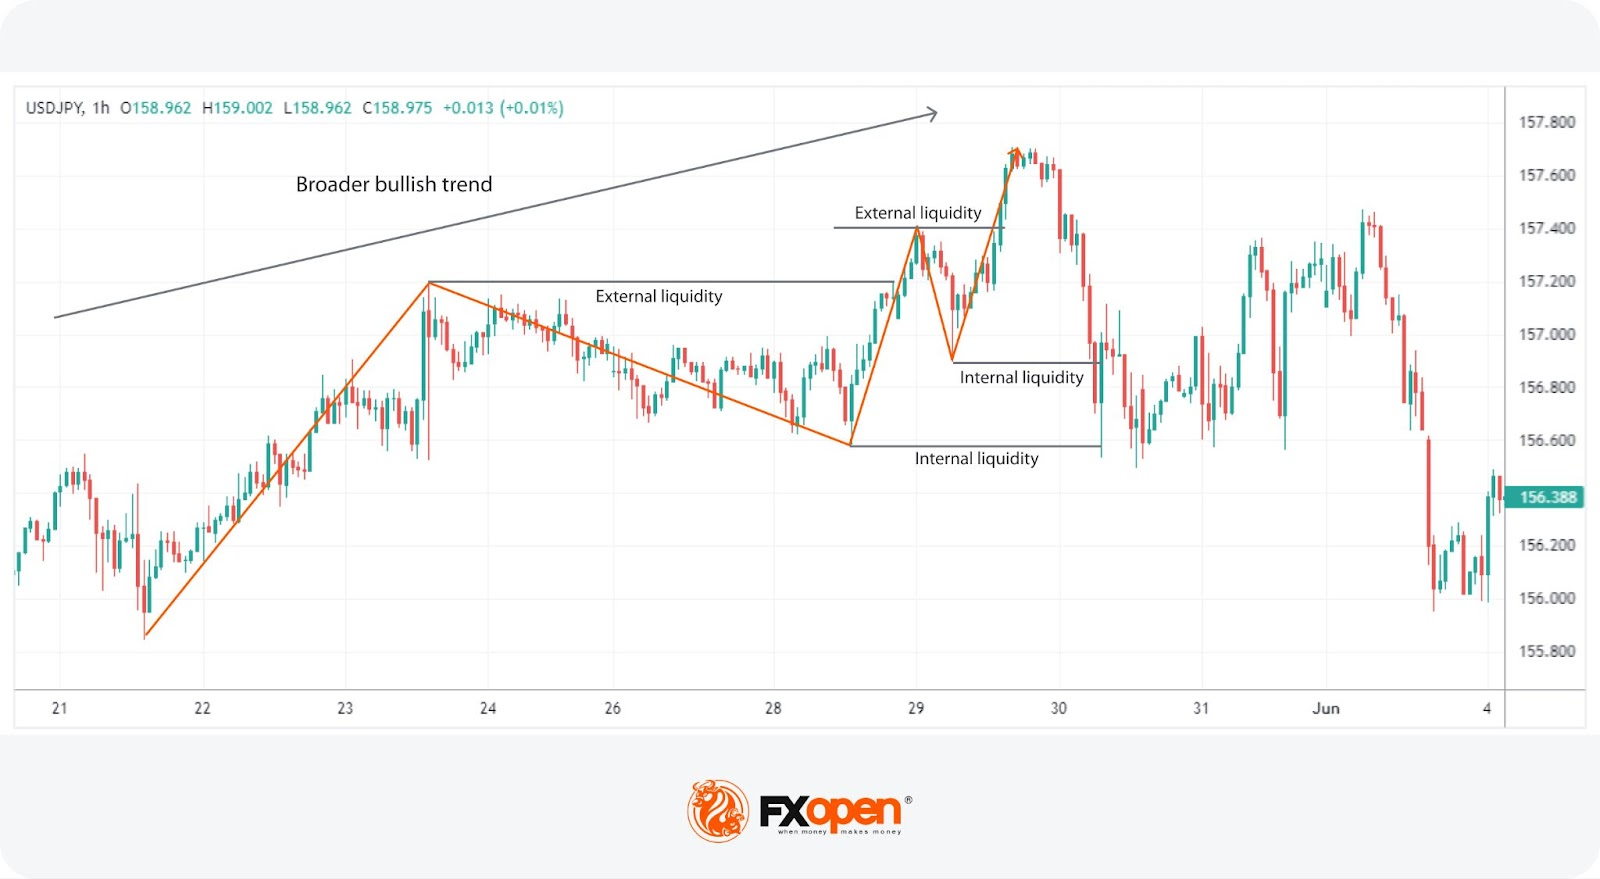
This refers to the liquidity available within the range of the higher timeframe structure. It involves identifying smaller support and resistance levels within the larger range. For example, in a bullish leg, there will be a series of higher highs and higher lows; beneath these higher lows is where internal liquidity rests. This internal liquidity will be targeted to form a bearish leg as part of a higher timeframe bullish trend.
External Liquidity
This involves liquidity that exists outside the major highs and lows of the higher timeframe trend. To use the example of the bullish leg in a higher timeframe bullish trend, the low it originated from and the high it creates as the bearish retracement begins count as areas of external liquidity.
Order Blocks and Imbalances
While not directly involved in the ICT Turtle Soup setup, understanding order blocks and imbalances can provide insight into where the price might head and the general market context.
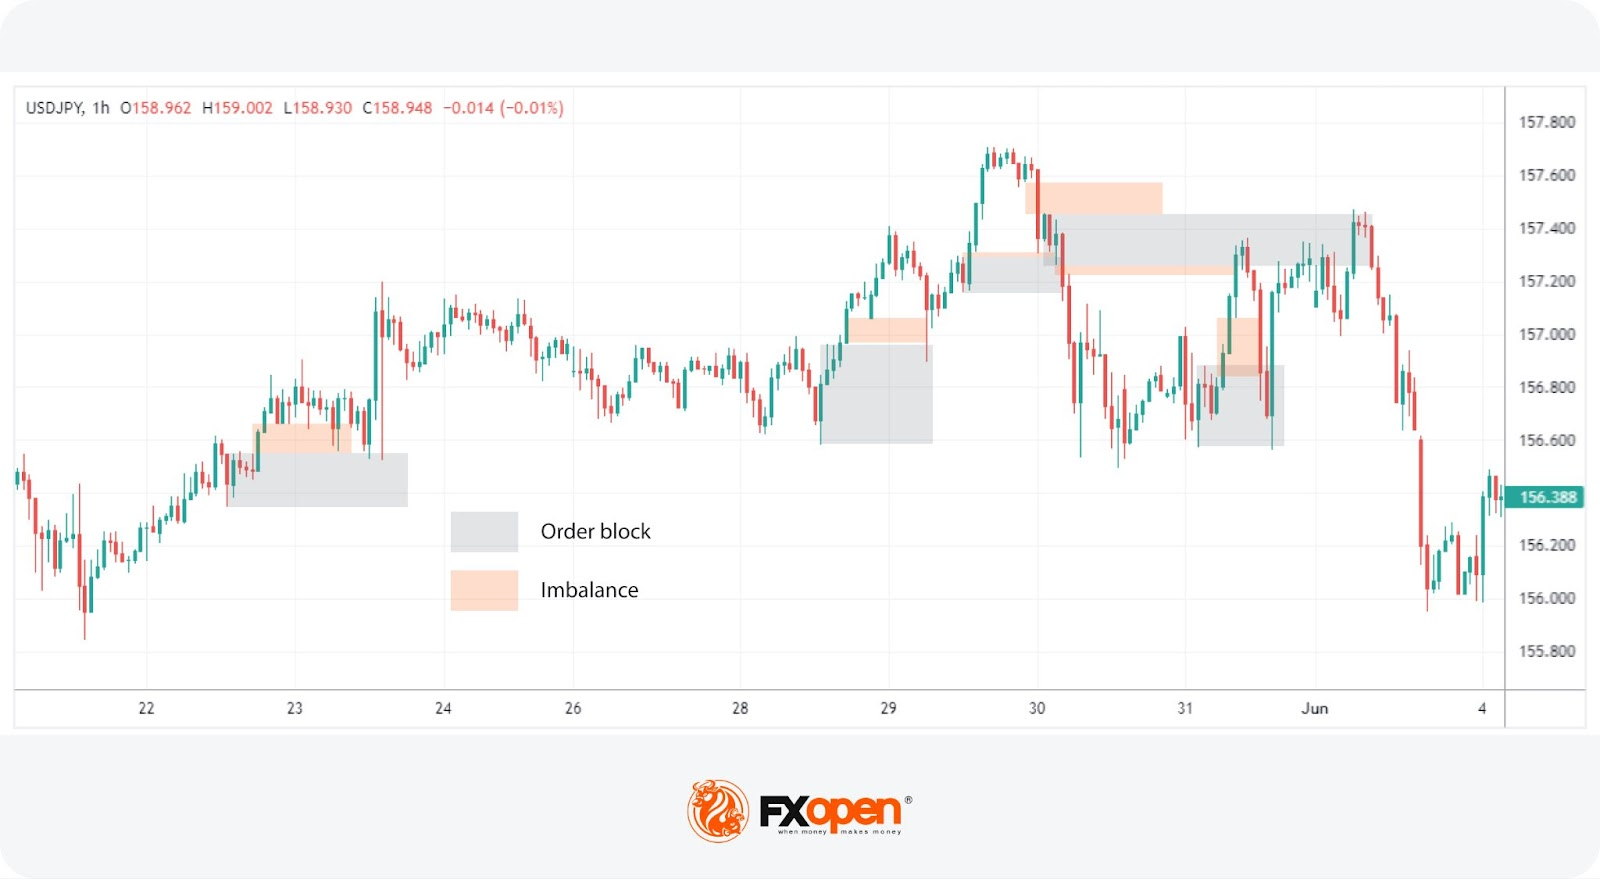
Order blocks are areas where significant buying or selling activity has previously occurred, often due to institutional orders. These blocks represent zones of support and resistance where the price is likely to react.
Bullish Order Blocks
These are typically found at the base of a significant upward move and indicate zones where buying interest is strong. When the price revisits these areas, it often finds support, making them potential entry points for long trades.
Bearish Order Blocks
Conversely, these are located at the top of significant downward moves and signal strong selling interest. These zones often act as resistance when revisited, making them strategic points for short trades.
Imbalances
Imbalances, or fair value gaps (FVGs), are price regions where the market has moved too quickly, creating a significant disparity between the number of long and short trades. These gaps often occur due to high volatility and indicate areas where the market might revisit to "fill" the gap, thereby achieving fair value.
In other words, when a price rapidly moves in one direction, it leaves behind an area with little to no trading activity. The market often returns to these imbalanced zones to facilitate proper price discovery and liquidity.
Application of the ICT Turtle Soup Strategy
Here's a detailed breakdown of how traders use the ICT Turtle Soup pattern.
Establishing a Bias

Traders begin by analysing the higher timeframe trend, such as the daily or weekly charts, to establish a market bias. This analysis may help determine whether the market is predominantly bullish or bearish. Identifying this trend is crucial as it guides where to look for potential Turtle Soup setups.
For instance, the example above shows AUDUSD initially moving down after a bullish movement off-screen. It eventually breaks above the lower high, indicating that the higher timeframe trend may now be bullish. Similarly, the shorter-term downtrend beginning from mid-May also saw a new high, meaning a trader may want to look for long positions.
Identifying Internal Liquidity
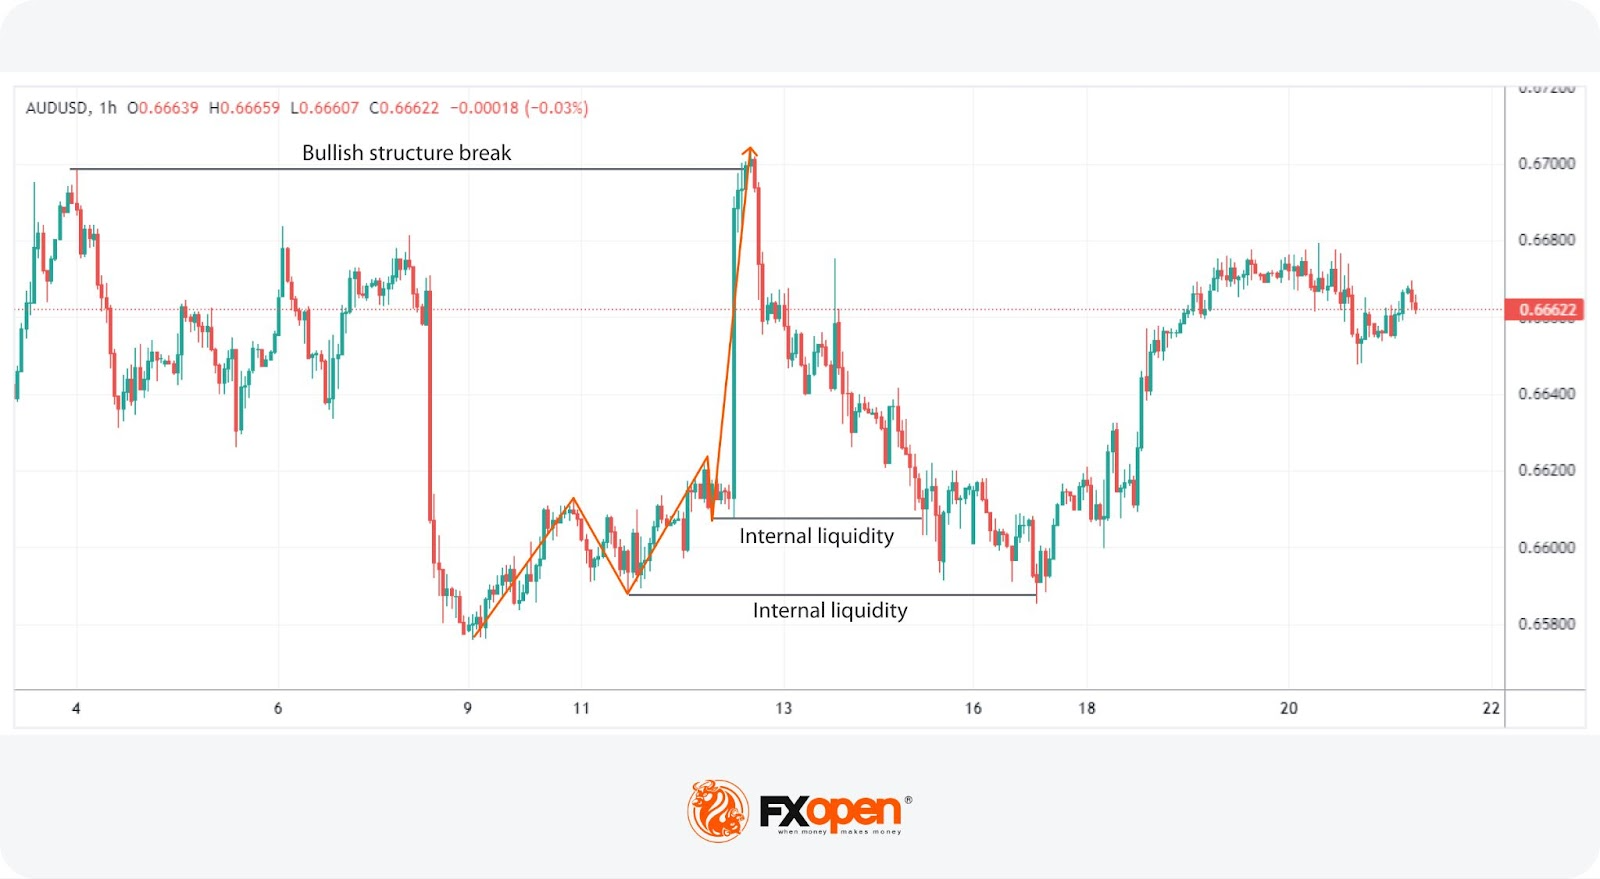
Once the higher timeframe trend is established, traders look for a move counter to that higher timeframe trend. In the example shown, this would be a downtrend counter to the bullish structure break. They mark levels of internal liquidity; in a bullish leg, these would be below swing lows and vice versa. These areas are likely to attract stop-loss orders.
Looking for Liquidity Taps
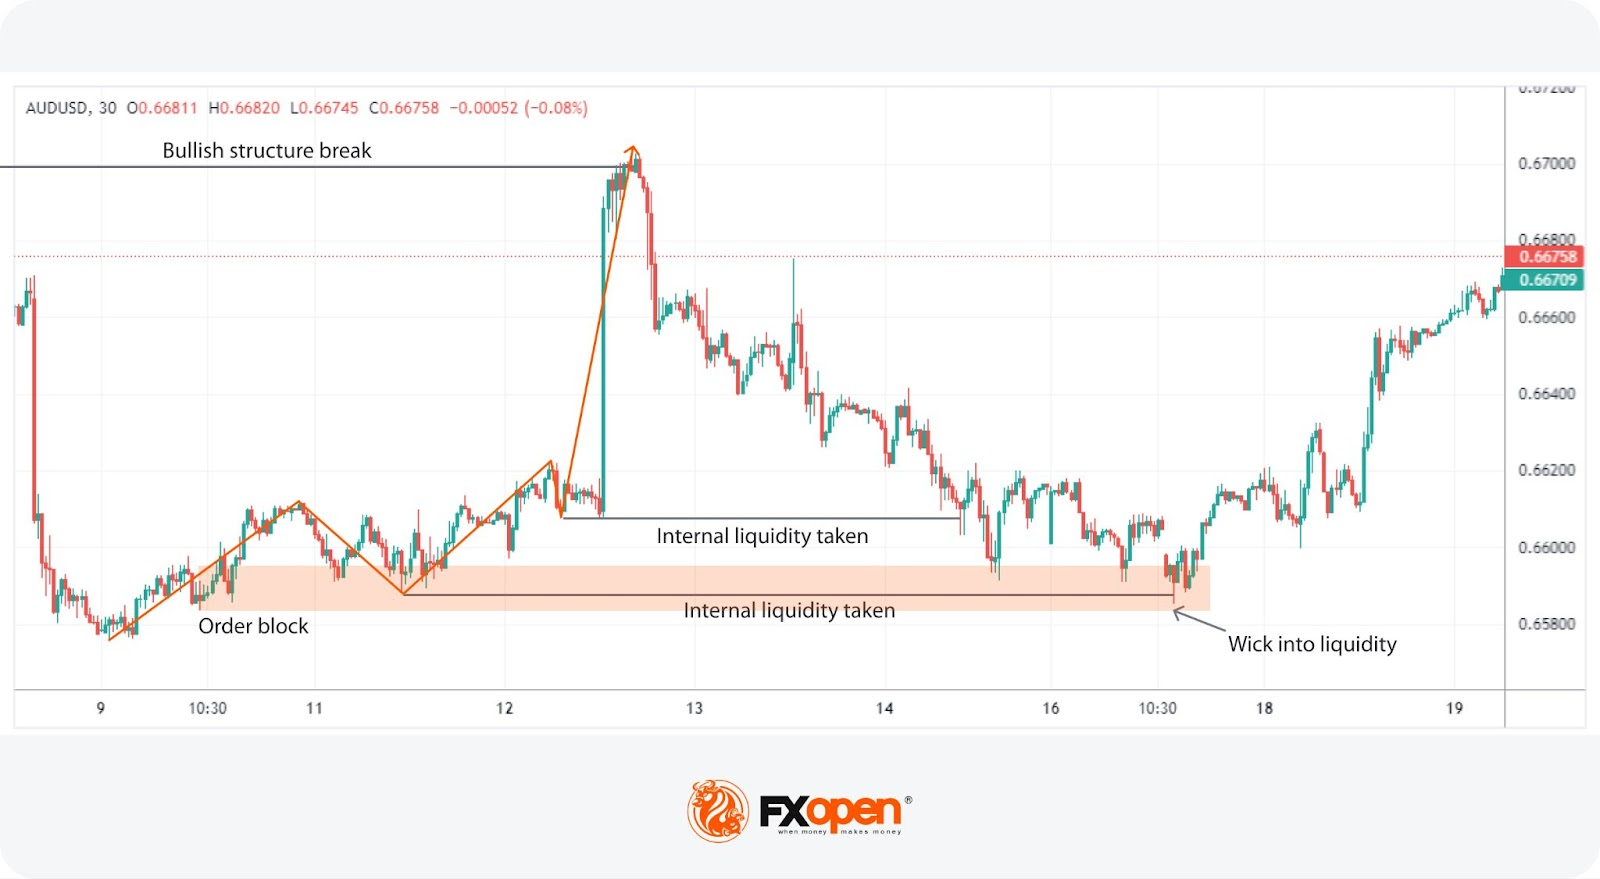
The next step involves waiting for these internal liquidity areas to be tapped. This typically happens when the price briefly breaks through a support or resistance level, triggering stop-loss orders before quickly reversing direction.
Ideally, the price should tap into the same area or order block where the internal liquidity formed and then exhibit a quick reversal, often leaving just a small wick. This movement indicates a liquidity grab, where large players have taken out stops to facilitate their own orders.
Lower Timeframe Confirmation
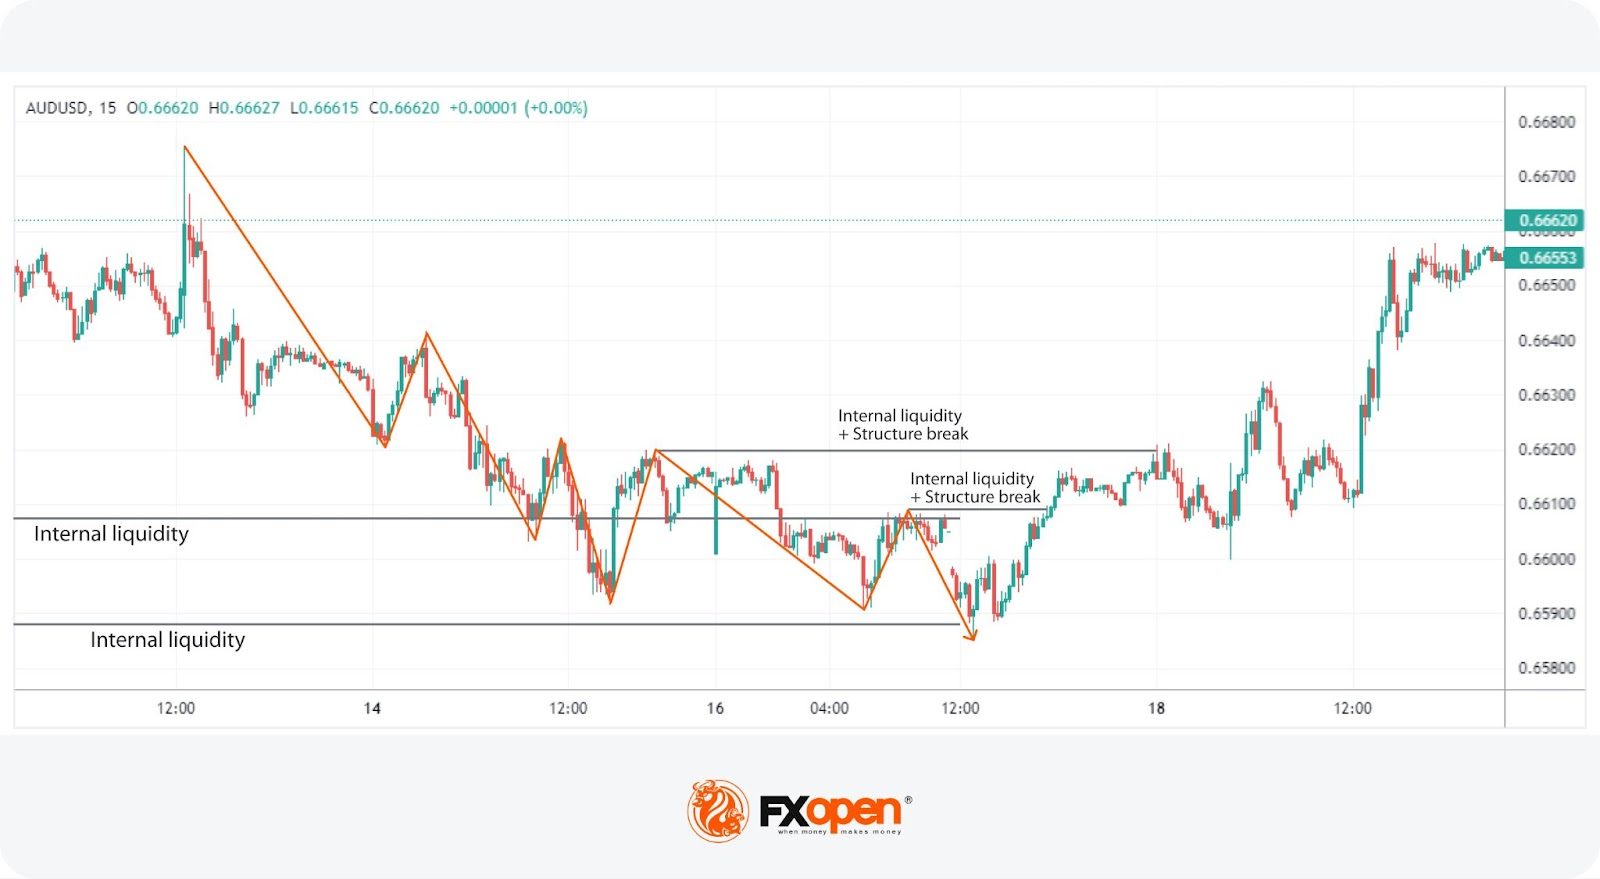
After identifying a liquidity grab beyond this internal liquidity level, traders look for an entry. On a lower timeframe, they look for a similar pattern: internal liquidity being run and a subsequent break of structure in the direction of the higher timeframe trend. This involves price retracing back inside the range to fill an imbalance and meet an order block, which provides a precise entry point.
Executing the Trade
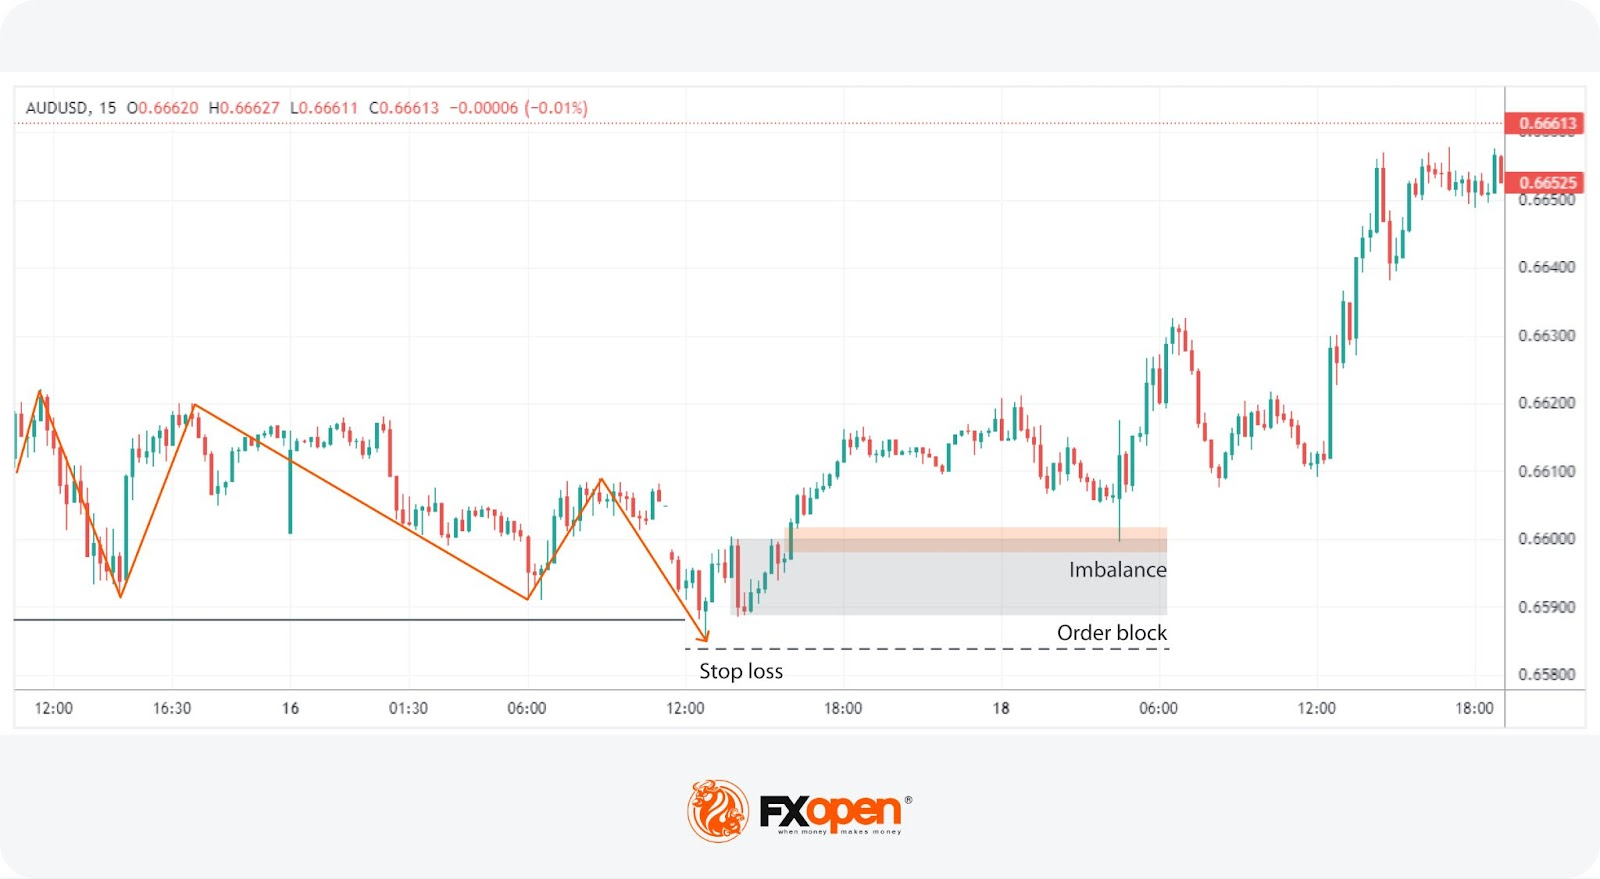
Once these conditions are met, traders typically enter the market. Specifically, they’ll often leave a limit order at an order block to trade in the direction of the higher timeframe trend. They place a stop loss just beyond the liquidity grab, either above the recent high for a short trade or below the recent low for a long trade. Profit targets are often set at major liquidity levels, such as previous highs or lows, where the market is likely to encounter significant activity.
Potential Advantages and Limitations
The ICT Turtle Soup pattern is a trading strategy with several potential benefits and drawbacks.
Advantages
- Precision: Allows for precise entry points by identifying false breakouts and liquidity grabs.
- Adaptability: May be used across different timeframes and market conditions, including ranging and trending markets.
- Risk Management: Built-in risk management by placing stop losses just beyond the liquidity grab points.
Limitations
- Complexity: Requires a deep understanding of market structure, liquidity, and order flow, making it challenging for less experienced traders.
- Market Conditions: May lead to losing trades in highly volatile or illiquid markets where false signals are more common.
- Time-Consuming: Demands continuous monitoring of multiple timeframes to identify valid setups, which can be time-intensive.
The Bottom Line
The ICT Turtle Soup is a pattern that may support traders seeking to adjust their strategies to false breakouts and liquidity grabs in the market. By focusing on failed highs and lows around key support and resistance levels, it may help traders find suitable risk-to-reward ratios. However, as with any trading approach, success depends on disciplined execution, strict risk management, and alignment with broader market context.
To put your strategy into practice, consider opening an FXOpen account and access over 700 markets with tight spreads from 0.0 pips and low commissions from $1.50 per lot. Good luck!
FAQs
What Is ICT Turtle Soup in Trading?
ICT Turtle Soup is a trading pattern that exploits false breakouts. It identifies potential reversals when the price briefly moves beyond a major support or resistance level, triggering stop-loss orders before reversing direction. This strategy aims to take advantage of these liquidity grabs by entering trades opposite to the initial breakout direction.
What Are the Conditions for ICT Turtle Soup?
To identify the ICT Turtle Soup pattern, traders analyse higher timeframe trends to establish market bias. They then look for counter-trend moves and mark internal liquidity areas. The pattern is identified when the price taps these liquidity zones and reverses quickly, often leaving a small wick. This signals a liquidity grab and potential trade setup in the direction of the higher timeframe trend.
How May Traders Use the ICT Turtle Soup Pattern?
According to theory, using the ICT Turtle Soup pattern involves several steps. First, traders establish a market bias based on higher timeframe analysis. Then, they look for liquidity grabs at marked internal liquidity areas, indicating false breakouts. The next step is to confirm the setup on a lower timeframe by observing a similar liquidity grab and structure break. Lastly, they are supposed to enter trades in the direction of the higher timeframe trend, placing stop losses just beyond the liquidity grab and targeting key liquidity levels for profit-taking.
This article represents the opinion of the Companies operating under the FXOpen brand only. It is not to be construed as an offer, solicitation, or recommendation with respect to products and services provided by the Companies operating under the FXOpen brand, nor is it to be considered financial advice.
Stay ahead of the market!
Subscribe now to our mailing list and receive the latest market news and insights delivered directly to your inbox.


Latest articles

USD/JPY and USD/CAD Continue to Rise Ahead of Key Data Releases
The US dollar continues to strengthen against major counterparts as markets await important macroeconomic data scheduled for release in the coming hours. Investors are focusing on US GDP figures, the Personal Consumption Expenditures (PCE) price index, and Canada’s labour

Oracle (ORCL) Shares Jump Above $160
Following a strong earnings report, Oracle shares surged above $160, marking roughly a 1.5-month high:
→ Earnings per share: expected $1.70, actual $1.79;
→ Revenue: expected $16.7bn, actual $17.2bn.
This is the first quarter in 15 years

USD/JPY Approaches Key Resistance Level
The USD/JPY chart shows a bullish trend at the start of March, influenced by the escalation of military activity in the Middle East.
On one hand, the US dollar is strengthening due to increased demand for safe-haven assets. On