


FXOpen
Divergence is a popular tool for spotting potential shifts in market direction. While the general principles for identifying divergence are straightforward, distinguishing between regular and hidden forms can be more complex. In this article, we outline the main differences between regular and hidden divergence and demonstrate how traders may interpret their signals using practical examples.
What Is Divergence?
In technical analysis, the term divergence has two meanings. You may have heard of the MACD indicator. It’s an abbreviation for Moving Average Convergence Divergence. In this case, divergence stands for the movement of two lines relative to each other – they move away from each other. Convergence occurs when the lines move closer together.
The second meaning relates to the topic we will discuss in this article – how the price and the indicator relate to each other. Traders look for divergence between the price and an oscillator, like the relative strength index, stochastic, awesome oscillator, or MACD. It occurs when the market forms an extreme high or low, but the indicator doesn’t follow.
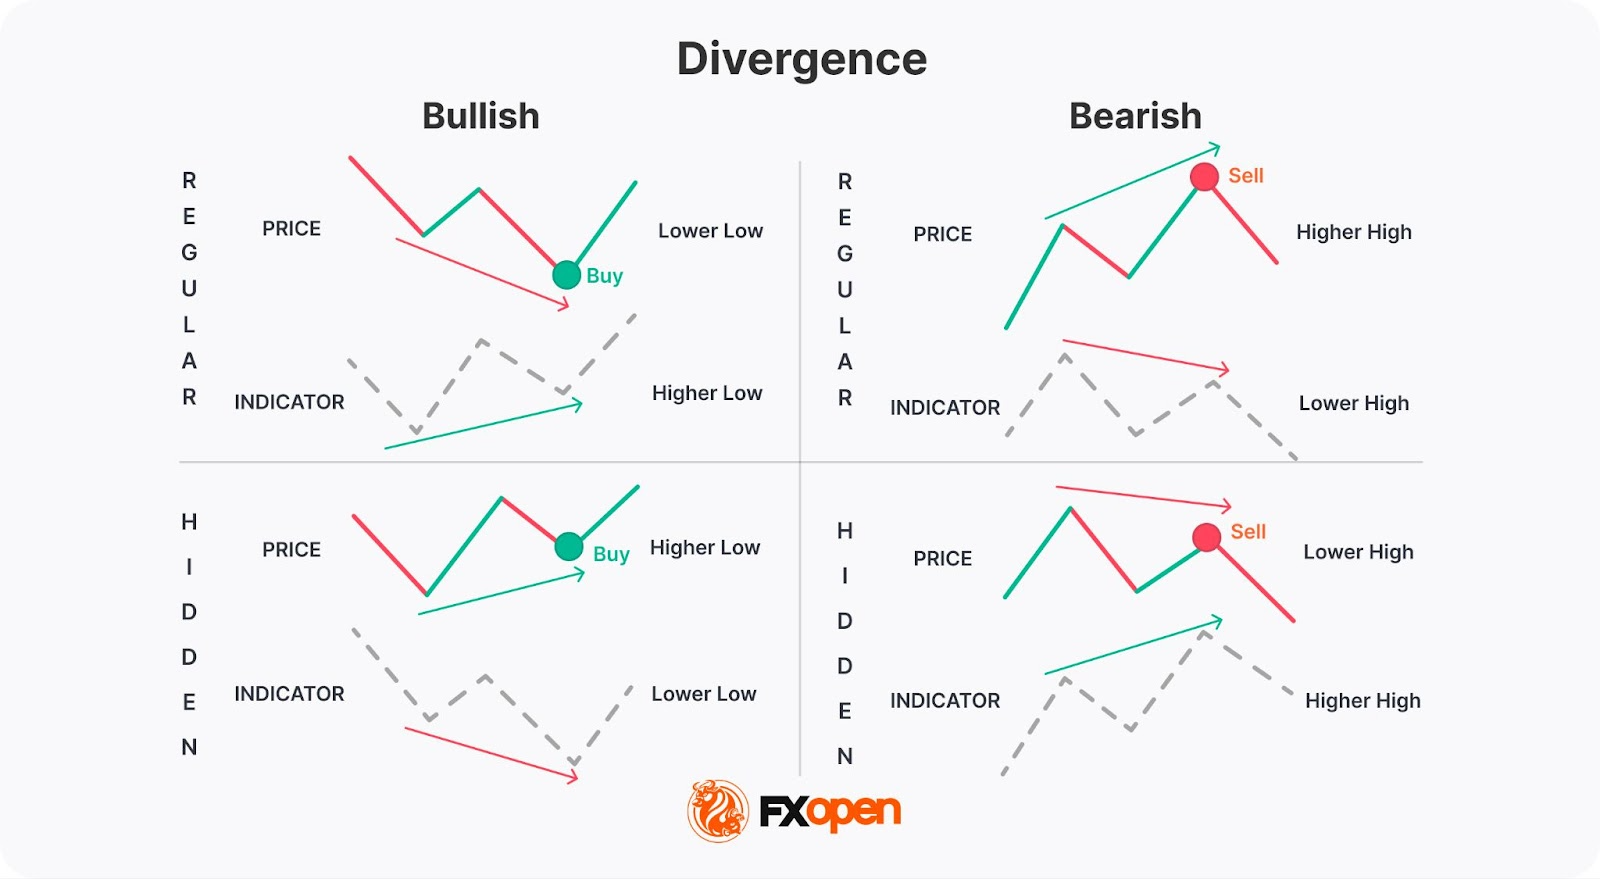
There are two types of divergence – regular or classic and hidden. Both are divided into bearish and bullish categories. Let’s consider the differences between regular and hidden divergence.
What Is Regular Divergence?
Regular divergence is a market condition that reflects waning strength of trend and momentum and is considered a strong signal of a market reversal. It can be bullish and bearish, meaning it shows downtrend and uptrend reversals, respectively.
The rules are the following:
- Bullish regular divergence. When the price forms lower lows, but the indicator sets higher lows, the market may turn up.
- Bearish regular divergence. When the price places higher highs, but the indicator sets lower highs, the market should decline.
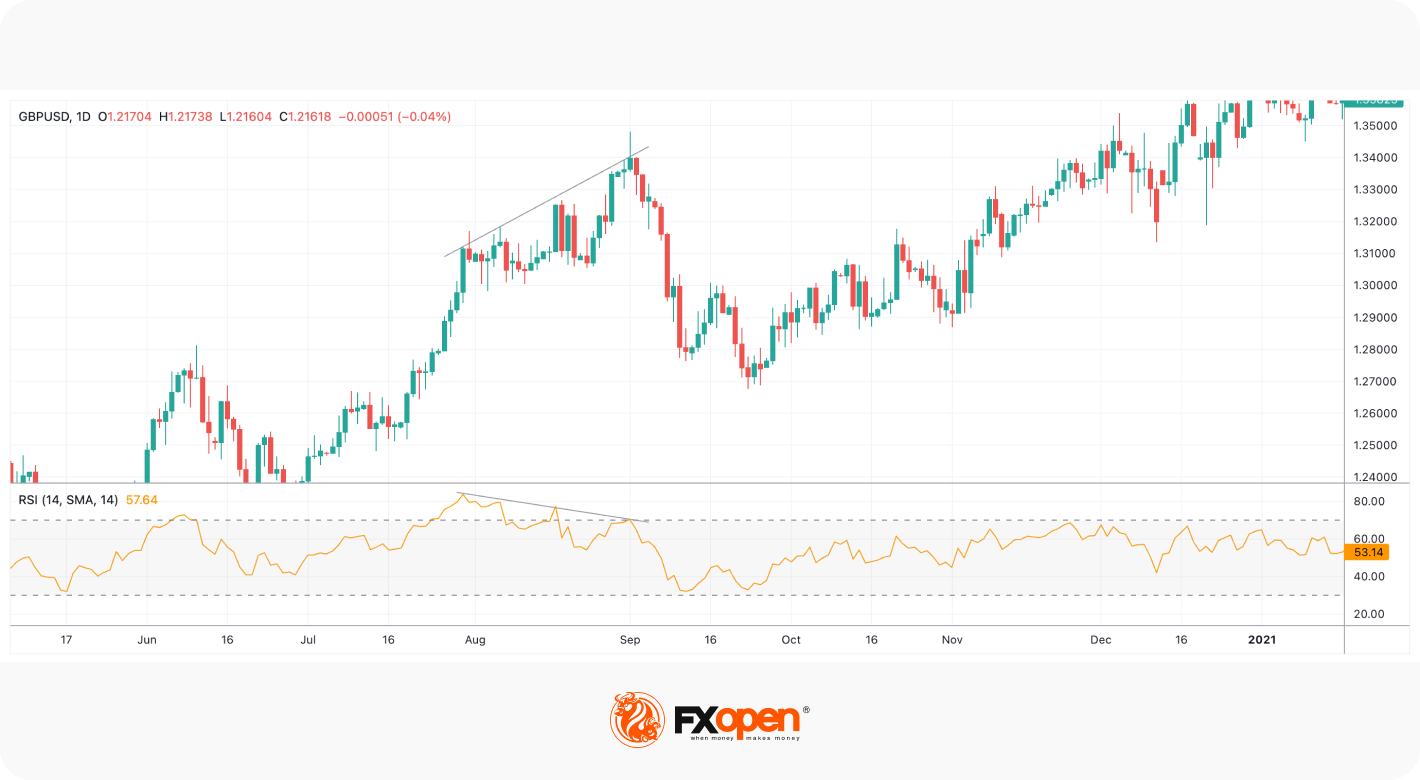
In the chart above, the price and the relative strength index formed a regular bearish divergence, and the market turned down. It’s worth noting that divergence doesn’t necessarily reflect a trend reversal; it may be a short-term correction in a solid trend, especially on long-term timeframes.
What Is Hidden Divergence?
Hidden divergence is called hidden because it’s less obvious than the regular type. According to theory, hidden divergence usually appears ahead of a trend continuation. It typically provides weaker signals but is still used in trading.
Hidden divergence rules are the following:
- Bullish hidden divergence. When the price forms higher lows, but the indicator sets lower lows, the market may rise soon.
- Bearish hidden divergence. When the price sets lower highs, but the indicator places higher highs, the market may turn down soon.
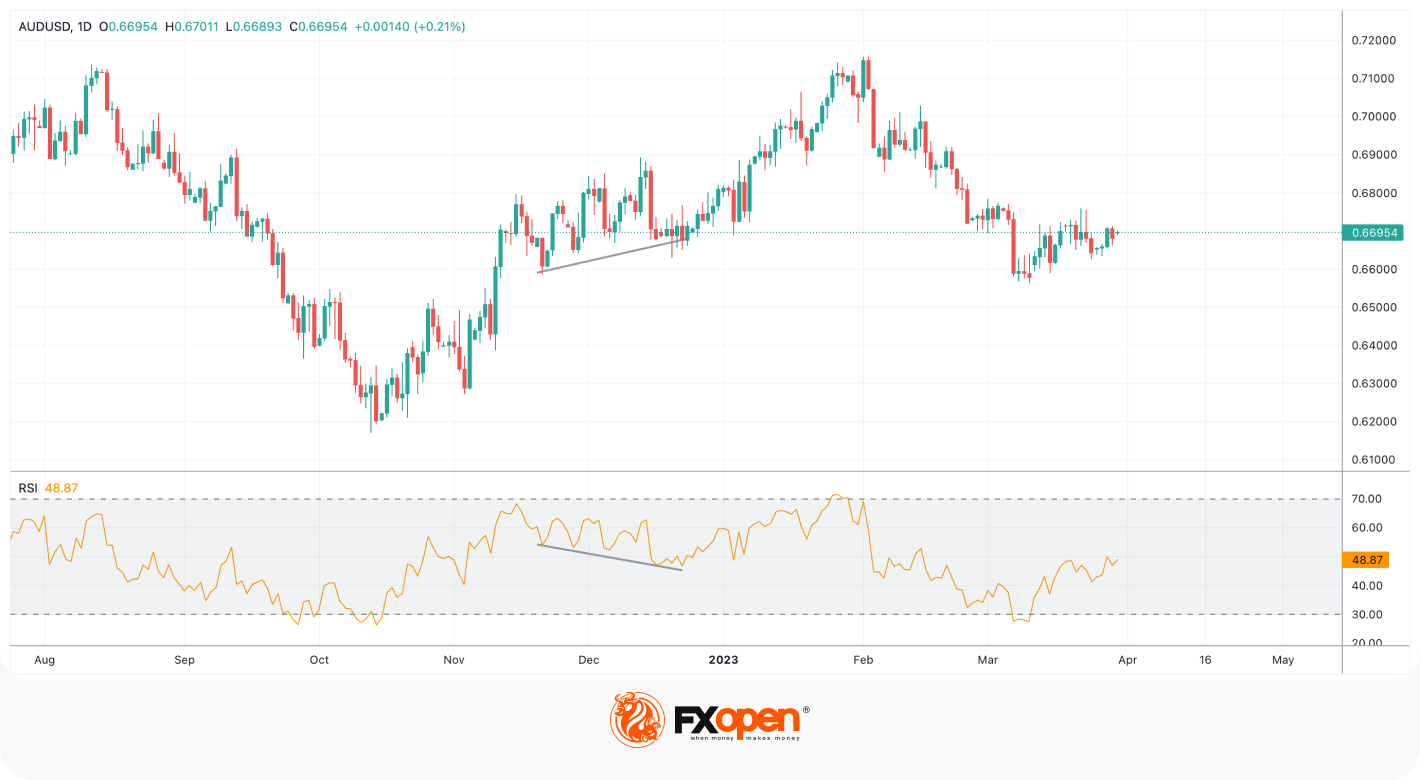
In the chart above, the price and the RSI formed a bullish hidden divergence, and the market continued moving upwards.
Hidden Divergence vs Regular Divergence: Where They Can Appear
The reliability of a divergence may depend on a timeframe and the trend's strength. According to theory, if it occurs in a medium- or long-term chart, it may provide a stronger signal. Additionally, if it appears in a solid trend, it's believed that the trend is likely to continue. If the trend is weakening, it may reverse soon.
However, two common rules to distinguish between divergences are:
- Regular variation usually occurs before a market reversal. It doesn’t necessarily mean a change in the overall trend but can be used to trade against the current direction. Here, it’s important to implement additional indicators to identify exit points.
- Hidden variation usually appears in a solid trend and signals a trend continuation.
If you want to test both types in a live market, you can consider opening an FXOpen account and access over 700 markets.
Regular Divergence vs Hidden Divergence: How Traders May Confirm Their Signals
None of the technical analysis tools work independently. As divergence signals are based on the strength of a trend, traders usually use indicators like moving averages. Let’s consider some live market examples.
Regular Divergence
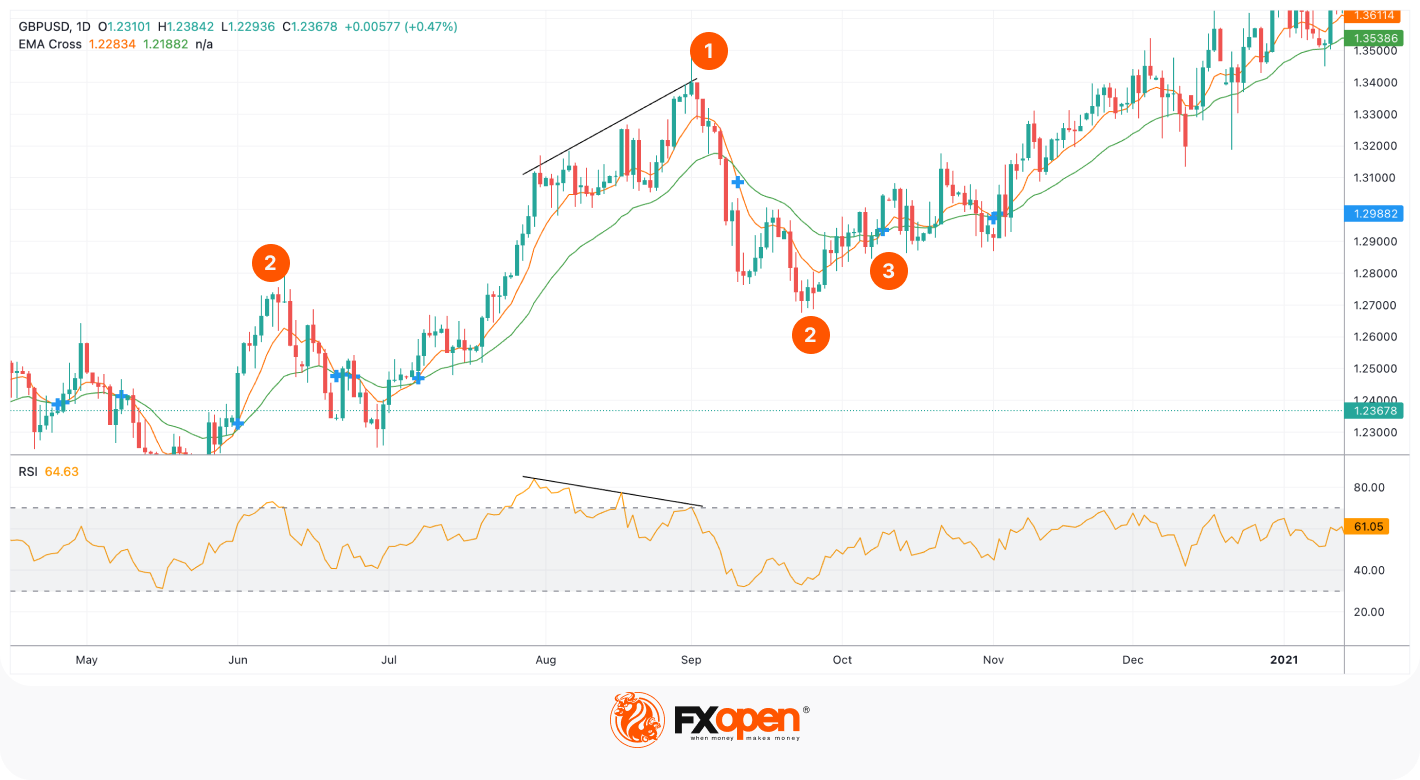
In the chart above, the price formed a regular bearish divergence with the relative strength index. The RSI left an overbought area, which was an additional confirmation of an upcoming decline. However, as it's risky to rely on one indicator, a trader could consider a signal of the shooting star candlestick (1). Appearing at the peak of an uptrend, it suggests a market reversal. While a trader could have used it to go short, this wouldn't be enough to identify exit points.
The nearest support level (2) wasn't that obvious, so a trader could have added the EMA cross tool. Although the exponential moving average is a lagging indicator, it can provide precise exit points if used with short periods. In this case, there are 9- and 26-day MAs. The trader could have exited the market once the EMA cross occurred (3).
A stop-loss level could have been calculated following the risk-reward ratio rules or placed above the high of the shooting star candlestick.
Hidden Divergence
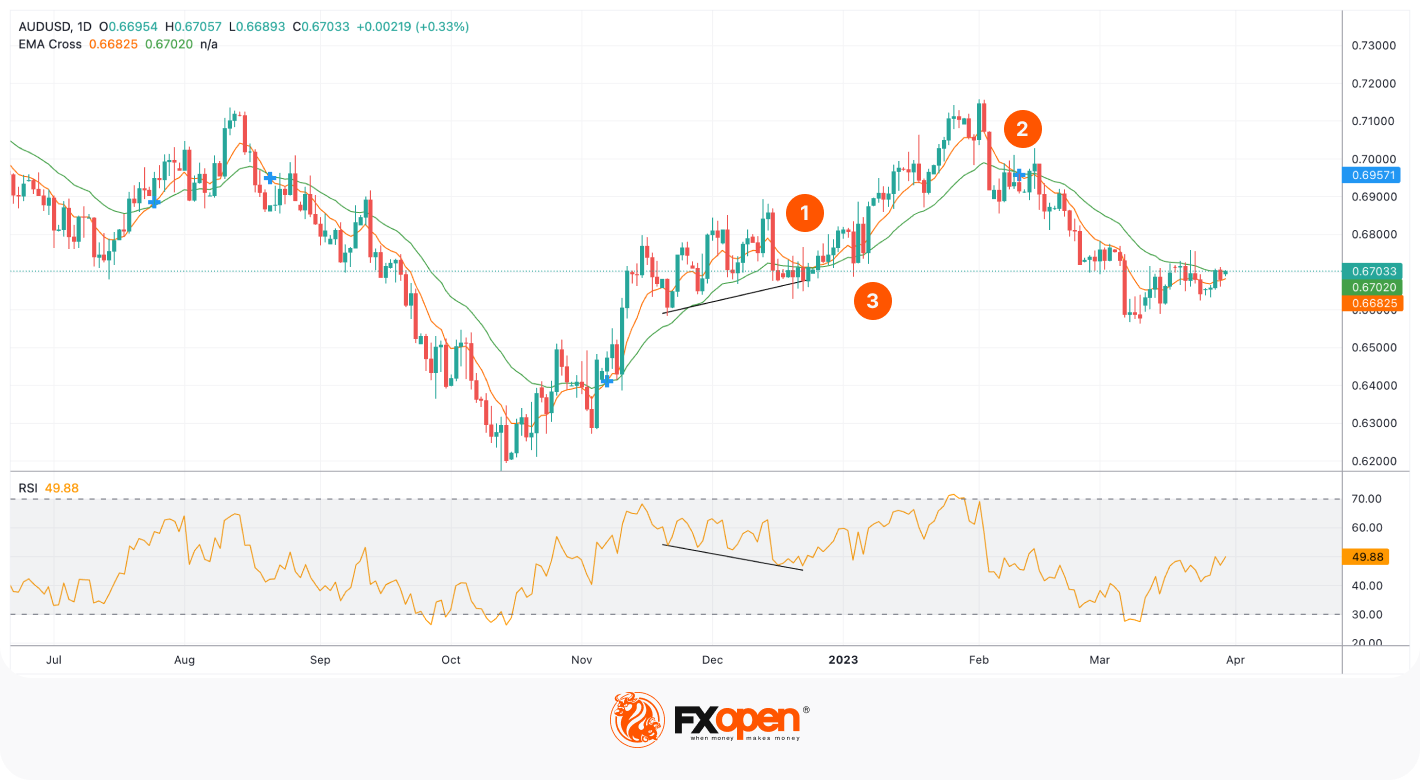
In the chart above, there is a hidden divergence between the price and the RSI indicator. As a hidden divergence usually occurs in a solid trend, a trader could use the EMA cross to confirm the trend direction. Although it’s a daily chart, we used exponential moving averages with periods of 9 and 26 as they are more sensitive to market fluctuations and have a smaller lag than longer-term MAs. To confirm a market rise, a trader could have checked the crossover. As the shorter-term MA (orange) was above the longer-term MA (green), it was a confirmation of a trend continuation (1), so a trader could have opened a long position.
However, this wouldn’t have determined the period of the rise. Therefore, a trader could have utilised the opposite cross of EMAs (2) or placed take-profit targets at the nearest resistance levels. A stop-loss level could have been placed below the closest support levels (3).
If you want to test these and other technical analysis tools, you can consider using the TickTrader trading platform that provides over 1,200 tools for comprehensive market analysis.
Final Thoughts
Divergence is a valuable concept in technical analysis that may help traders anticipate potential changes in price direction or confirm the strength of an existing trend. Understanding the difference between regular and hidden divergence may be important when developing trading strategies. When combined with other technical tools and sound risk management, divergence can support traders in the decision-making process.
Consider opening an account at FXOpen and gain access to tight spreads, low commissions, and over 700 markets. Good luck!
FAQ
What Is the Difference Between Hidden and Regular Divergence?
Regular divergence usually indicates a potential trend reversal, while hidden divergence suggests a trend continuation. Also, they have different rules: in regular divergence, the price and oscillator diverge from each other, while in hidden one, they converge.
What Is the Hidden Divergence Rule?
The hidden divergence rule is that when price forms a higher low (in an uptrend) or a lower high (in a downtrend), but the indicator shows the opposite, it signals that the prevailing trend is likely to continue.
What Is Bullish Hidden Divergence?
Bullish hidden divergence occurs in an uptrend when the price forms a higher low, but an indicator (such as RSI or MACD) makes a lower low. This suggests underlying strength in the current uptrend.
How May You Identify Bearish Divergence?
Bearish regular divergence appears when the price forms a higher high, but the indicator prints a lower high. This signals weakening buying momentum and can indicate a potential trend reversal to the downside. At the same time, bearish hidden divergence occurs when the price forms a lower high, but the indicator moves upwards. This type may signal a continuation of a downtrend.
How Bullish Hidden Divergence May Be Confirmed?
Bullish hidden divergence might be confirmed by looking for additional technical signals, such as support holding on higher timeframes or increasing trading volume that supports the continuation of the uptrend. Using multiple indicators together may help strengthen the confirmation.
This article represents the opinion of the Companies operating under the FXOpen brand only. It is not to be construed as an offer, solicitation, or recommendation with respect to products and services provided by the Companies operating under the FXOpen brand, nor is it to be considered financial advice.
Stay ahead of the market!
Subscribe now to our mailing list and receive the latest market news and insights delivered directly to your inbox.


Latest articles

Tesla (TSLA) Shares Surge Following Musk’s Announcements
According to the chart, Tesla (TSLA) shares had been under significant pressure since the start of 2026: from their December high, they had lost around 25% of their value. The main bearish drivers included:
→ Intense competition from Chinese automakers, particularly

XTI/USD Analysis: WTI Oil Prices Under Pressure from Trump’s Statements
Yesterday, following a false bullish breakout above the psychological $100 level, WTI crude prices fell sharply towards the $85 area. The primary driver of this rapid decline was comments made by the US President.
According to Donald Trump:
→ the United
