


Falling Wedge Trading Pattern: Unique Features and Trading Rules
FXOpen
Various chart patterns give an indication of possible market direction. A falling wedge is one such formation that indicates a possible bullish reversal. This FXOpen article will help you understand whether the falling wedge pattern is bullish or bearish, what its formation signifies about the market direction, and how it can be used to spot trading opportunities.
What Is a Falling Wedge Pattern?
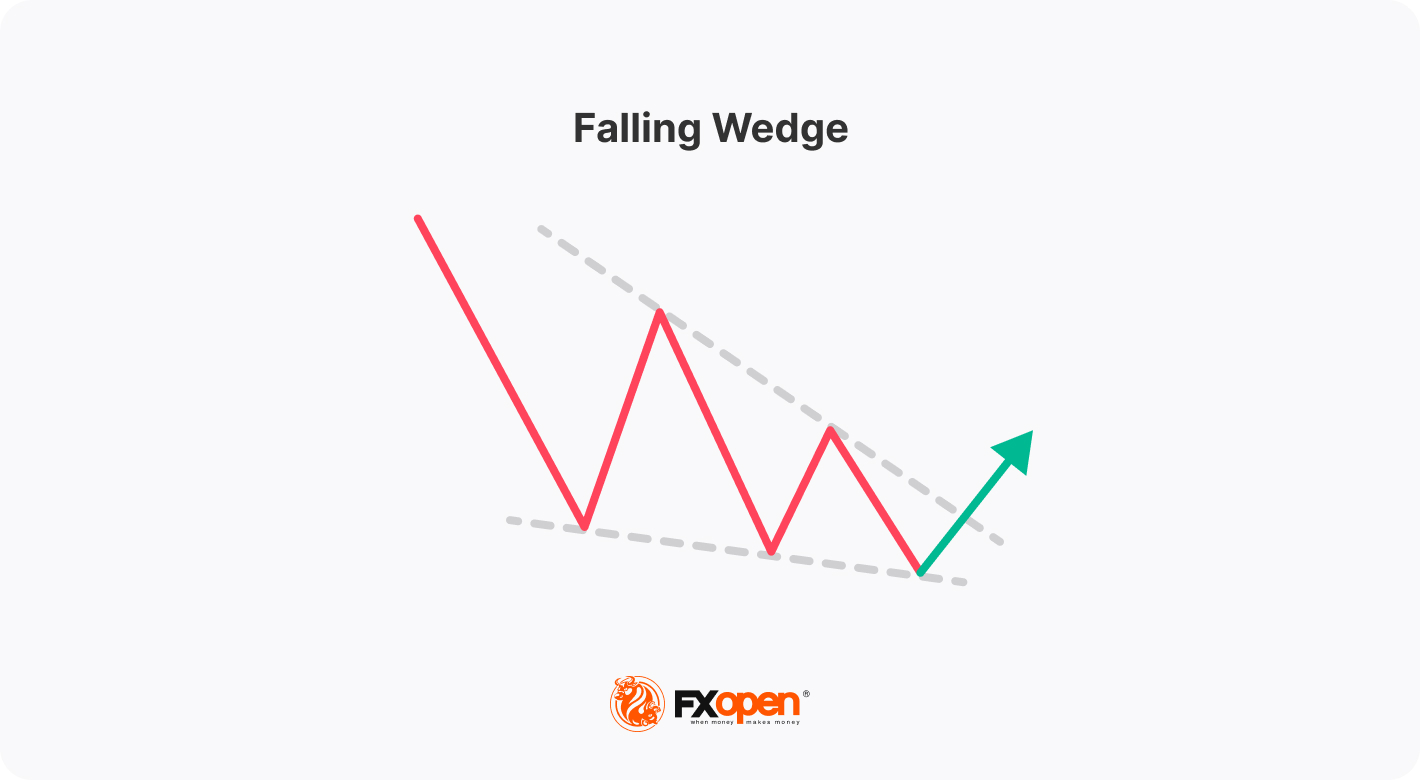
Also known as the descending wedge, the falling wedge technical analysis chart pattern is a bullish formation that typically occurs in the downtrend and signals a trend reversal. It forms when an asset's price drops, but the range of price movements starts to get narrower. As the formation contracts towards the end, the buyers completely absorb the selling pressure and consolidate their energy before beginning to push the market higher. A falling wedge pattern means the end of a market correction and an upside reversal.

How Can You Spot a Falling Wedge on a Price Chart?
This pattern is usually spotted in a downtrend, which would indicate a possible bullish reversal. However, it may appear in an uptrend and signal a trend continuation after a market correction. Either way, the falling wedge provides bullish signals. The descending formation generally has the following features.
- Price Action. The price trades lower, forming lower highs and lower lows.
- Trendlines. Traders draw two trendlines. One connects the lower highs, and the other connects the lower lows. Finally, they intersect towards a convergence point. Each line should connect at least two points. However, the greater the number, the higher the chance of the market reversal.
- Contraction. The contraction in the price range signals decreasing volatility in the market. As the formation matures, new lows contract as the selling pressure decreases. Thus, the lower trendline acts as support, and the price consolidating within the narrowing range creates a coiled spring effect, finally leading to a sharp move on the upside. The price breaks through the upper trendline resistance, indicating that sellers are losing control and buyers are gaining momentum, resulting in an upward move.
- Volume. The trading volume ideally decreases as the pattern forms, and the buying volume increases with the breakout above the upper trendline, reflecting a shift in momentum towards the buyers.
Falling and Rising Wedge: Differences
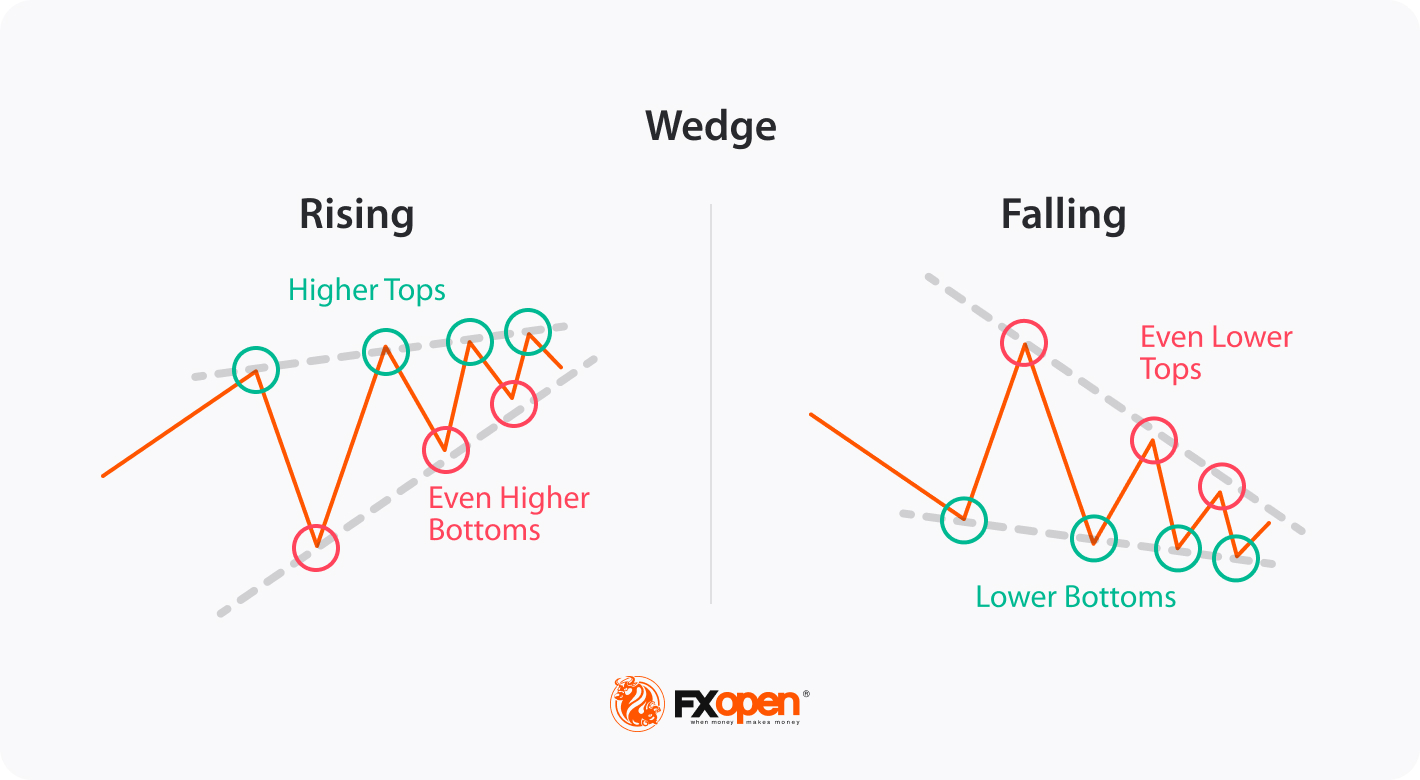
There are two types of wedge formation – rising (ascending) and falling (descending).
An ascending wedge occurs when the highs and lows rise, while a descending wedge pattern has lower highs and lows. In an ascending formation, the slope of the lows is steeper and converges with the upper trendline at some point, while in a descending formation, the slope of the highs is steeper and converges with the support trendline at some point.
Usually, a rising wedge indicates that sellers are taking control, resulting in a downside breakdown. Conversely, a descending wedge pattern indicates that buyers are gaining momentum after consolidation, generally resulting in an upside breakout.
The Falling Wedge: Trading Rules
Trading the falling wedge involves waiting for the price to break above the upper line, typically considered a bullish reversal. The pattern’s conformity increases when it is combined with other technical indicators.
- Entry
According to theory, the ideal entry point is after the price has broken above the wedge’s upper boundary, indicating a potential upside reversal. Furthermore, this descending wedge breakout should be accompanied by an increase in trading volume to confirm the validity of the signal.
The price may retest the resistance level before continuing its upward movement, providing another opportunity to enter a long position. However, the entry point should be based on the traders' risk management plan and trading strategy.
- Take Profit
It is essential to determine an appropriate target level. Traders typically set a profit target by measuring the height of the widest part of the formation and adding it to the breakout point. Another approach some traders use is to look for significant resistance levels above the breakout point, such as previous swing highs.
- Stop Loss
Traders typically place their stop-loss orders just below the lower boundary of the wedge. Also, the stop-loss level can be based on technical or psychological support levels, such as previous swing lows. In addition, the stop-loss level should be set according to the trader's risk tolerance and overall trading strategy.
Use the TickTrader trading platform to develop your own trading strategy with the falling wedge.
Trading Example
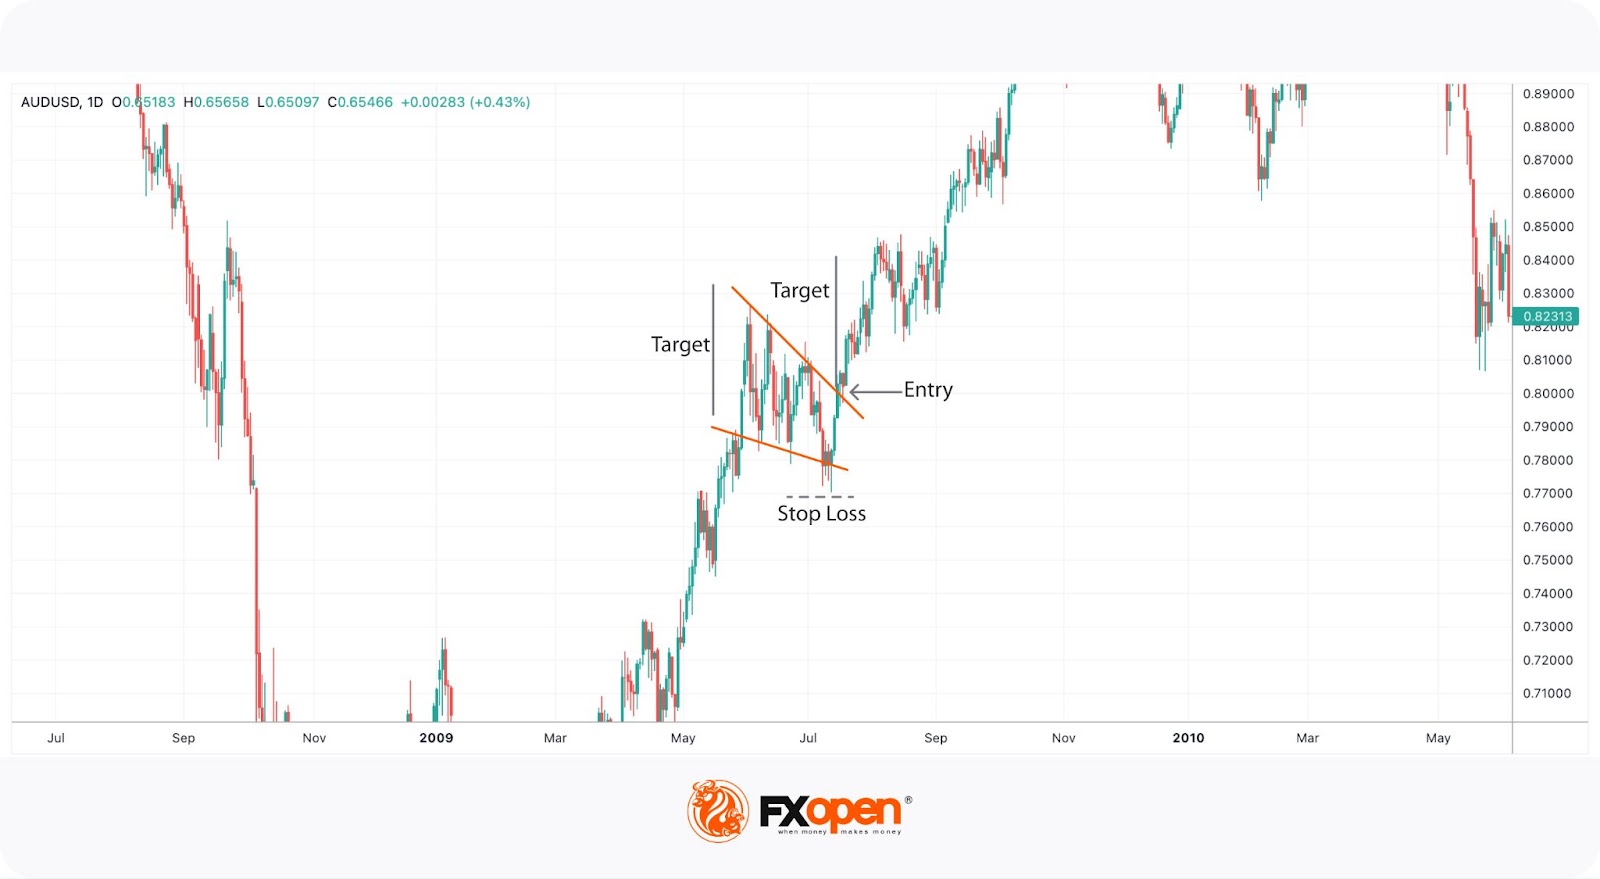
In the chart above, there is a falling wedge. A trader opened a buy position on the close of the breakout candlestick. A stop loss was placed below the wedge’s lower boundary, while the take-profit target was equal to the pattern’s widest part.
Falling Wedge and Other Patterns
Here are chart patterns that can be confused with a falling wedge.
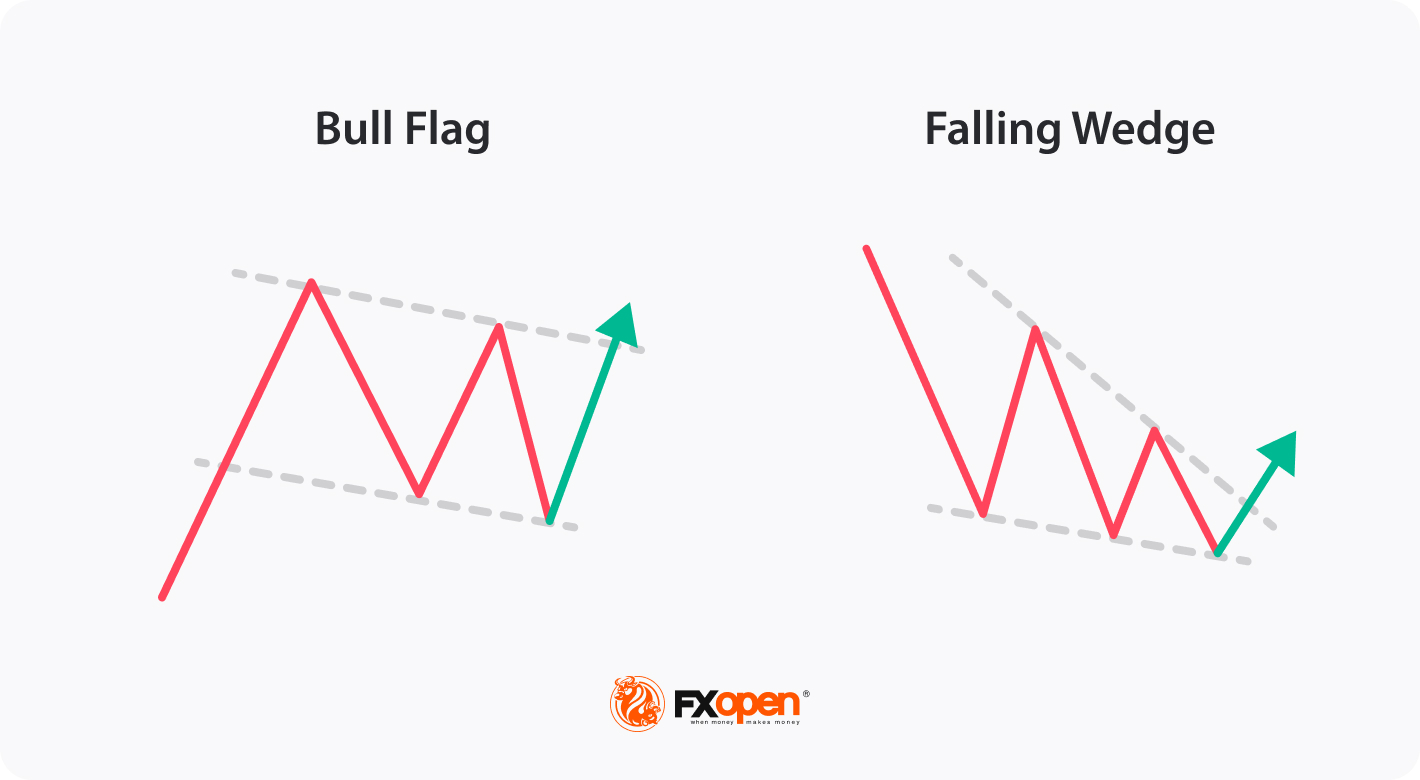
Falling Wedge vs Bullish Flag
These are two distinct chart formations used to identify potential buying opportunities in the market, but there are some differences between the two.
A descending wedge is a bullish setup, forming in a downtrend. It is characterised by two converging trendlines that slope downward, signalling decreasing selling pressure. A breakout above the upper trendline suggests a bullish move.
A bullish flag appears after a strong upward movement and forms a rectangular shape with parallel trendlines that slope slightly downward or move sideways. This formation represents a brief consolidation before the market resumes its upward trajectory.
While the falling wedge indicates a potential shift in a downtrend, the bullish flag suggests a continuation of an uptrend.
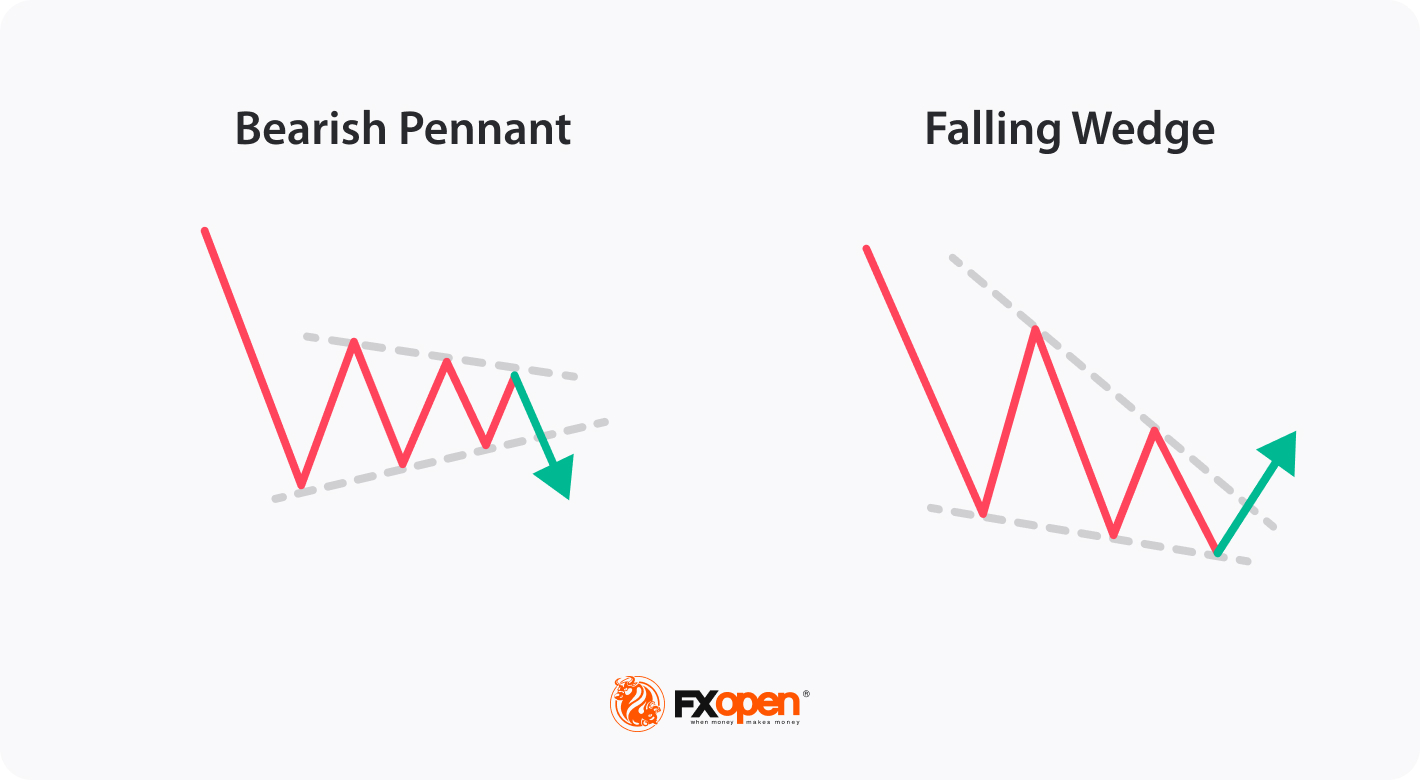
Falling Wedge vs Bearish Pennant
The falling wedge features two converging trendlines that slope downward, indicating decreasing selling pressure and often signalling a bullish reversal when the price breaks above the upper trendline.
Conversely, the bearish pennant forms after a significant downward movement and is characterised by converging trendlines that create a small symmetrical triangle. This pattern represents a consolidation phase before the market continues its downward trend upon breaking below the lower trendline.
While the falling wedge suggests a potential bullish move, the bearish pennant indicates a continuation of the bearish trend.
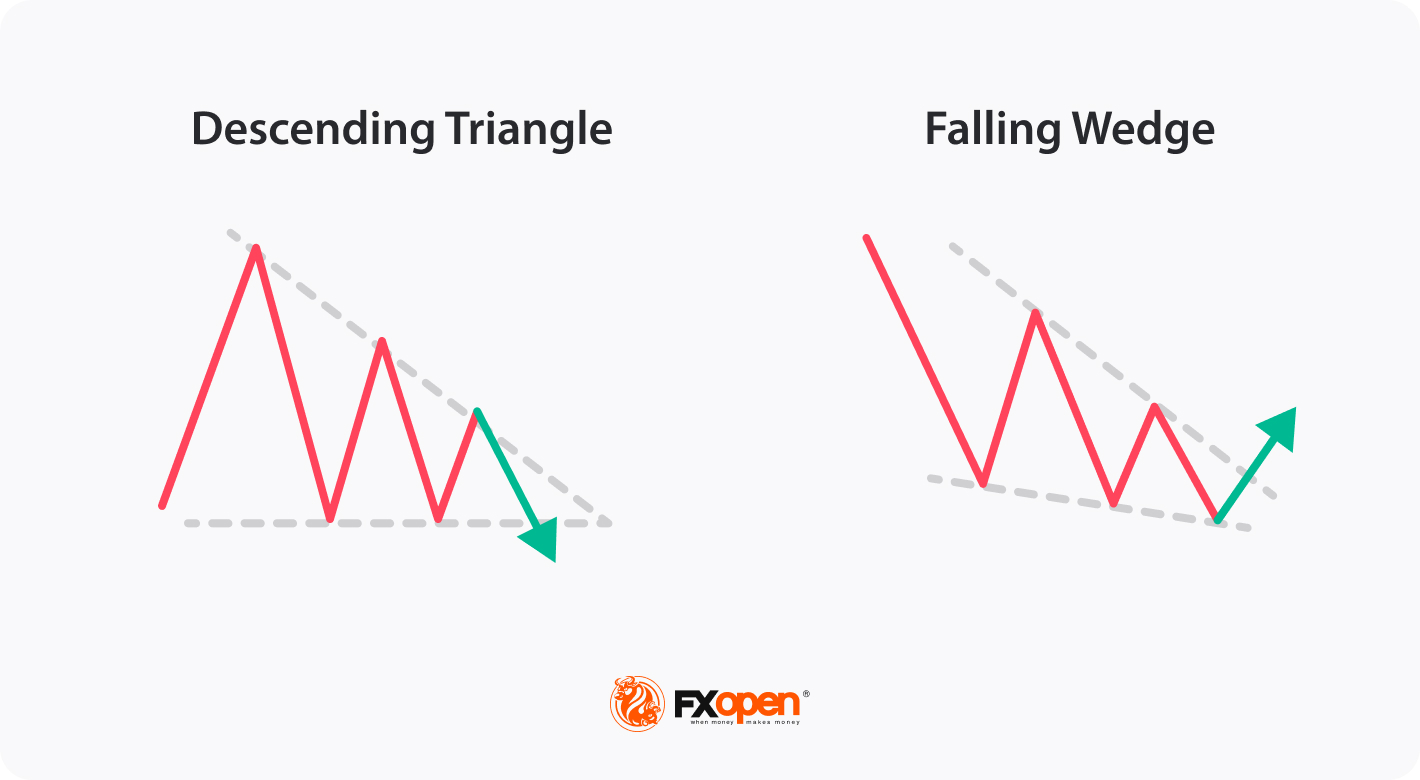
Falling Wedge vs Descending Triangle
The falling wedge consists of two downward-sloping converging trendlines, indicating decreasing selling pressure and often signalling a bullish reversal when the price breaks above the upper trendline. In contrast, the descending triangle features a flat lower trendline and a downward-sloping upper trendline, suggesting a buildup of selling pressure and typically signalling a bearish continuation when the price breaks below the flat lower trendline.
While the falling wedge is associated with a potential bullish move, the descending triangle generally indicates a bearish trend.
Falling Wedge: Advantages and Limitations
Like any technical pattern, the falling wedge has both limitations and advantages.
Advantages
- High Probability of a Reversal. The falling wedge is often seen as a strong, bullish signal, especially when it occurs after a downtrend. It suggests that selling pressure is subsiding, and a reversal to the upside may be imminent.
- Clear Entry and Exit Points. The pattern provides clear points for entering and exiting trades. Traders often enter when the price breaks out above the upper trendline and set stop-loss orders below a recent low within the formation.
- Versatility. The wedge can be used in various market conditions. It is effective in both continuation and reversal scenarios, though it is more commonly associated with bullish reversals.
- Widely Recognised. Since the falling wedge is a well-known formation, it is often self-fulfilling to some extent, as many traders recognise and act on it, further driving the market.
Limitations
- False Breakouts. Like many chart patterns, the falling wedge is prone to false breakouts. Prices may briefly move above the resistance line but then fall back below, trapping traders.
- Dependence on Market Context. The effectiveness of the falling wedge can vary depending on broader market conditions. In a strong downtrend, it might fail to result in a significant reversal.
- Requires Confirmation. The wedge should be confirmed with other technical indicators or analysis tools, such as volumes or moving averages, to increase the likelihood of an effective trade. Relying solely on the falling wedge can be risky.
- Limited Use in Low-Volatility Markets. In markets with low volatility, the falling wedge may not be as reliable, as price movements might not be strong enough to confirm the falling wedge's breakout.
The Bottom Line
The falling wedge is a powerful chart pattern that can offer valuable insights into potential trend reversals or continuations, depending on its context within the broader market. By understanding and effectively utilising the falling wedge in your strategy, you can enhance your ability to identify many trading opportunities. As with all trading tools, combining it with a comprehensive trading plan and proper risk management is crucial. Open an FXOpen account to trade in over 600 markets and enjoy attractive trading conditions.
FAQ
Is a Falling Wedge Bullish?
Yes, the falling wedge is a bullish continuation pattern in an uptrend, and it acts as a bullish reversal formation in a bearish market.
What Does a Falling Wedge Pattern Indicate?
It indicates that the buyers are absorbing the selling pressure, which is reflected in the narrower price range and finally results in an upside breakout.
What Is the Falling Wedge Pattern Rule?
The falling wedge is a technical analysis formation that occurs when the price forms lower highs and lower lows within converging trendlines, sloping downward. Its rule is that a breakout above the upper trendline signals a potential reversal to the upside, often indicating the end of a downtrend or the continuation of a strong uptrend.
How to Trade Descending Wedge Patterns?
To trade descending wedges, traders first identify them by ensuring that the price is making lower highs and lows within converging trendlines. Then, they wait for the price to break out above the upper trendline, ideally accompanied by increased trading volume, which confirms the breakout. After the breakout, a common approach is to enter a long position, aiming to take advantage of the anticipated upward movement.
What Is the Target of the Descending Wedge Pattern?
The target for a descending wedge is typically set by measuring the maximum width of the wedge at its widest part and projecting that distance upwards from the breakout point. This projection gives a potential price target.
What Is the Entry Point for a Falling Wedge?
The entry point for a falling wedge is ideally just after the breakout above the upper trendline. Some traders prefer to wait for a retest of the broken trendline, which may act as a new support level, before entering a trade to confirm the breakout.
*At FXOpen UK and FXOpen AU, Cryptocurrency CFDs are only available for trading by those clients categorised as Professional clients under FCA Rules and Professional clients under ASIC Rules, respectively. They are not available for trading by Retail clients.
This article represents the opinion of the Companies operating under the FXOpen brand only. It is not to be construed as an offer, solicitation, or recommendation with respect to products and services provided by the Companies operating under the FXOpen brand, nor is it to be considered financial advice.
Stay ahead of the market!
Subscribe now to our mailing list and receive the latest market news and insights delivered directly to your inbox.


Latest articles

Amazon Earnings: Does the Chart Already Know Something the Numbers Don't?
All eyes are on July 30, when Amazon reports Q2 2026 earnings, with Wall Street increasingly convinced the bar has been set too low. Consensus sees EPS near $1.82-$2.26 on roughly $197 billion in revenue, but the

WTI Analysis: Gap Breaks Short-Term Trend as Price Remains Trapped Between the POC and Profile Boundary
WTI crude oil plunged by more than 7% on 27 July 2026 after the US suspended a series of strikes against Iran over the weekend, raising hopes of a diplomatic solution and the reopening of shipping through the Strait of

US Dollar Index: A Defining Week for the King of the Markets
The dollar heads into a pivotal week trading near 101.80, just off a 15-month high, with the Fed's July 29 meeting standing as the clear focal point. Markets currently price roughly a 65% chance of a hold, though renewed