


A Comprehensive Guide on How to Read Japanese Candlestick Patterns
FXOpen
Japanese candlesticks are an important tool for Forex trading. They’re one of the chart types traders use when analyzing an asset’s price movements. Among bars, lines, and Heikin Ashi, the Japanese candle chart is more helpful especially for beginners since it is the only one that reflects the emotions of market participants.
The history of candlesticks dates back to the 1700s. A Japanese rice trader, Homma, found an interconnection between the rice rate and market emotions which affected its demand and supply.
Read the FXOpen guide on how candlesticks display the emotions of buyers and sellers and how they help traders analyze the market.
Understanding Japanese Candlesticks
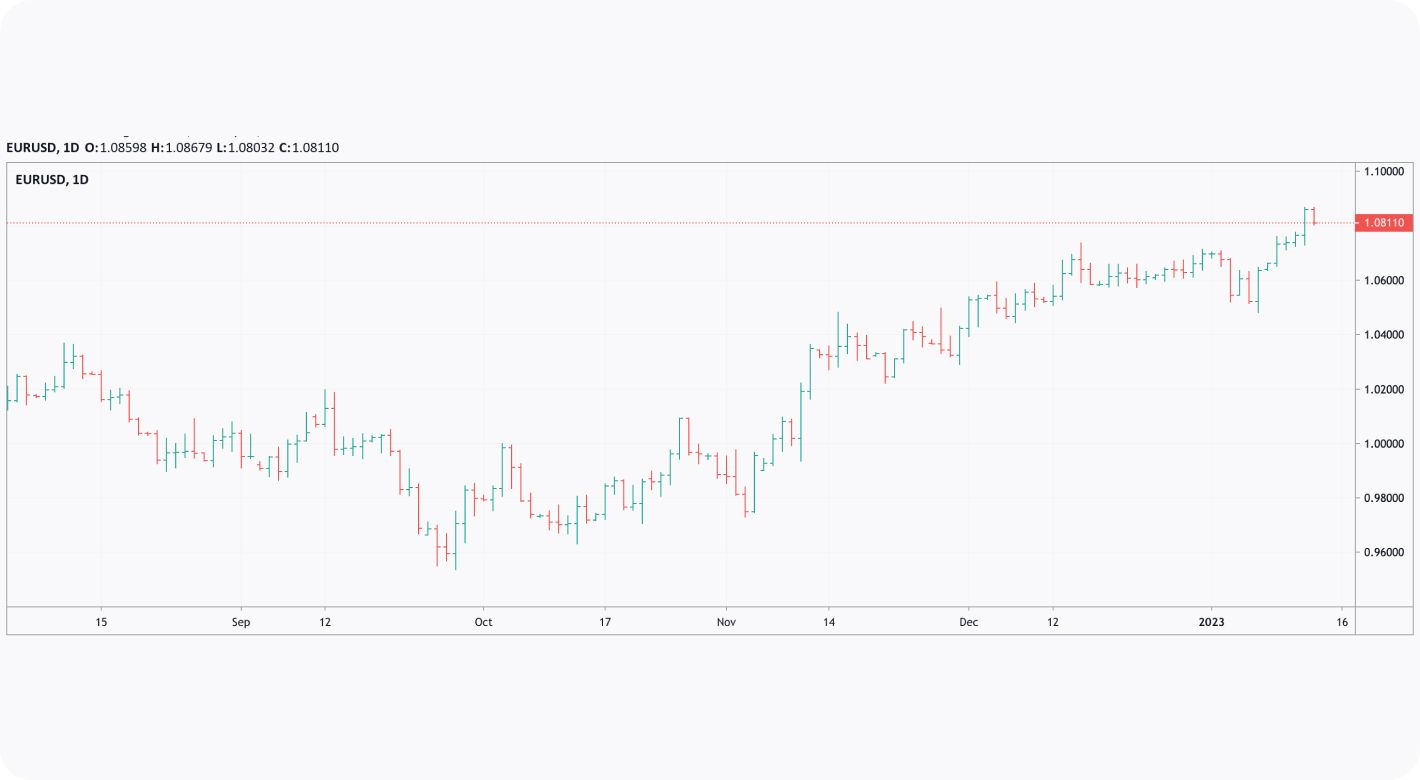
The Japanese candlestick is a helpful chart type. Each candle reflects an asset's open, close, lowest, and highest prices over a particular period. For example, if you consider a 5-minute timeframe of the EUR/USD pair, each candlestick will display its open, close, low, and high rates for 5 minutes.
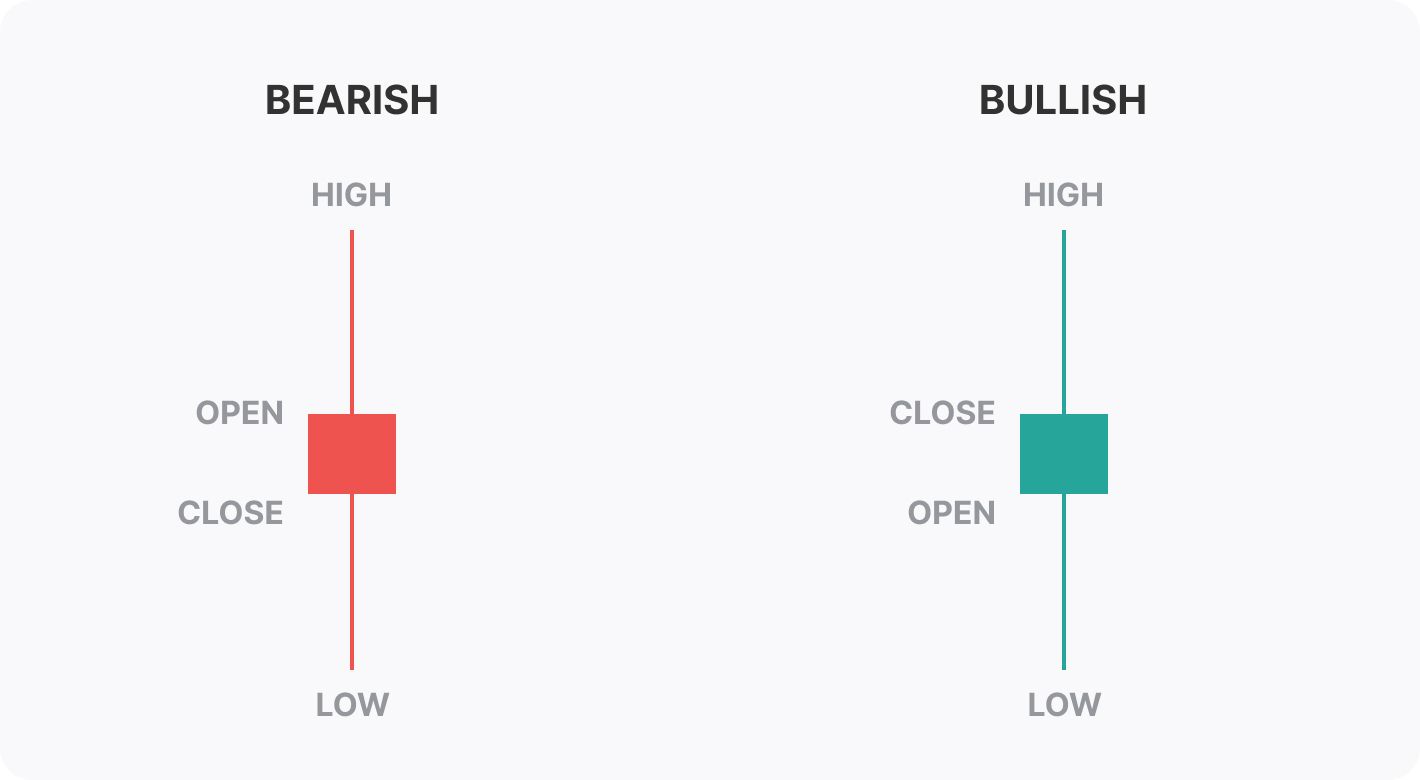
A candle consists of a body and shadows, where the body reveals open and close prices, while shadows stand for the highest and lowest rates of an asset.
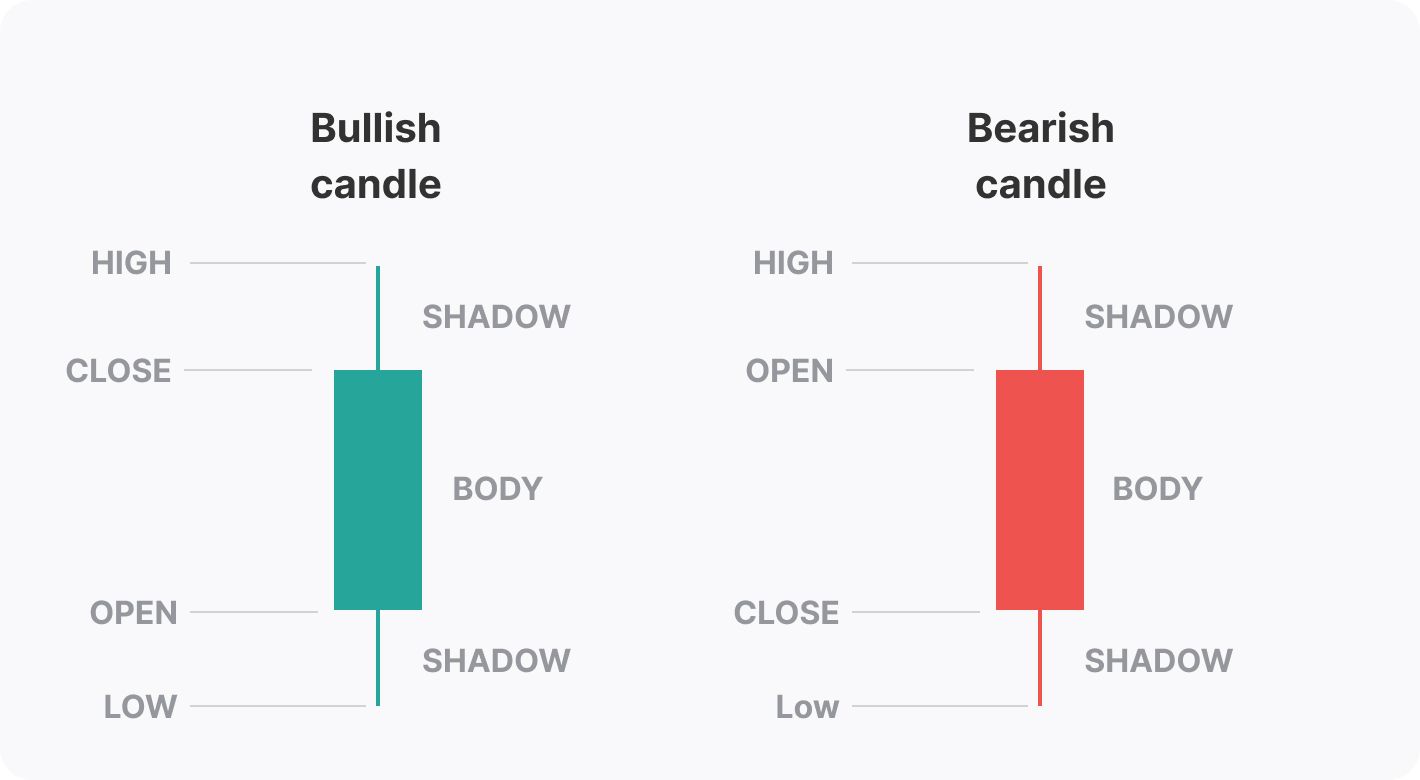
A Japanese candle may have any colour, but the most common ones are black or red for a bearish candle and white or green for a bullish candle.
Candlesticks and Bars: Are They Different?
Candlestick and bar charts reflect the same information — open, close, high and low prices over a period. However, they look different. A candle has a thick body and vertical wicks, making it easier to spot the strength of market participants. The bar is a thin line with ticks on either side.
Note: even if all bars have the same colour, you can identify whether they are bullish or bearish. In a bullish bar, the bottom tick is turned to the left and the top one is turned to the right. Conversely, a bearish bar has a top tick turned to the left and a bottom tick turned to the right.

Although the candlestick chart is more visual, some traders prefer bars to help them avoid market noise. Test both chart types on the FXOpen TickTrader platform and choose the one that suits your trading approach.
How to Read Japanese Candlesticks
To use Japanese candles in Forex trading, you need to understand how to read them. The size of a candlestick’s body and the length of its shadows tell a lot about the strength of buyers and sellers.
General Rules
Although every candlestick pattern provides particular signals, some general correlations between a candle’s body and shadows and market conditions have been found:
- Long shadows reflect high market volatility and trader indecision.
- A long upper shadow indicates bulls' weakness as they couldn't hold a price at new highs.
- A long lower shadow means bears were weak and unable to pull an asset’s rate to new lows.
- A long body shows the strength of either bulls or bears, depending on a candlestick's direction.
- Conversely, a short body says neither bulls nor bears could take control of the market.
- The smaller the candlestick, the lower volatility.
There are specific candle types that you can spot on a chart.
Marubozu

Marubozu is a candle that doesn't have shadows. This means that open and close prices were the highest and the lowest of a period.
When you see a Marubozu, you can see buyers (in a bullish Marubozu) or sellers (in a bearish Marubozu) were strong, as shadows usually indicate market indecision.
* The longer the shadow, the weaker buyers/sellers.
Usually, Marubozu appears at the beginning of a continuation or a reversal pattern. That is:
- If a bullish Marubozu is formed within a strong uptrend, it’s a sign the trend may continue. If it appears in a downtrend, it signals the trend may end soon.
- The downtrend will likely maintain if a bearish Marubozu occurs. In an uptrend, the candle alerts investors that the market may turn around.
Doji
If you see a candle with a thin body, it’s a Doji candle. Usually, a Doji has equal or almost equal open and close prices. Unlike a Marubozu candle that reveals the strength of buyers and sellers, a Doji shows a high level of indecision.
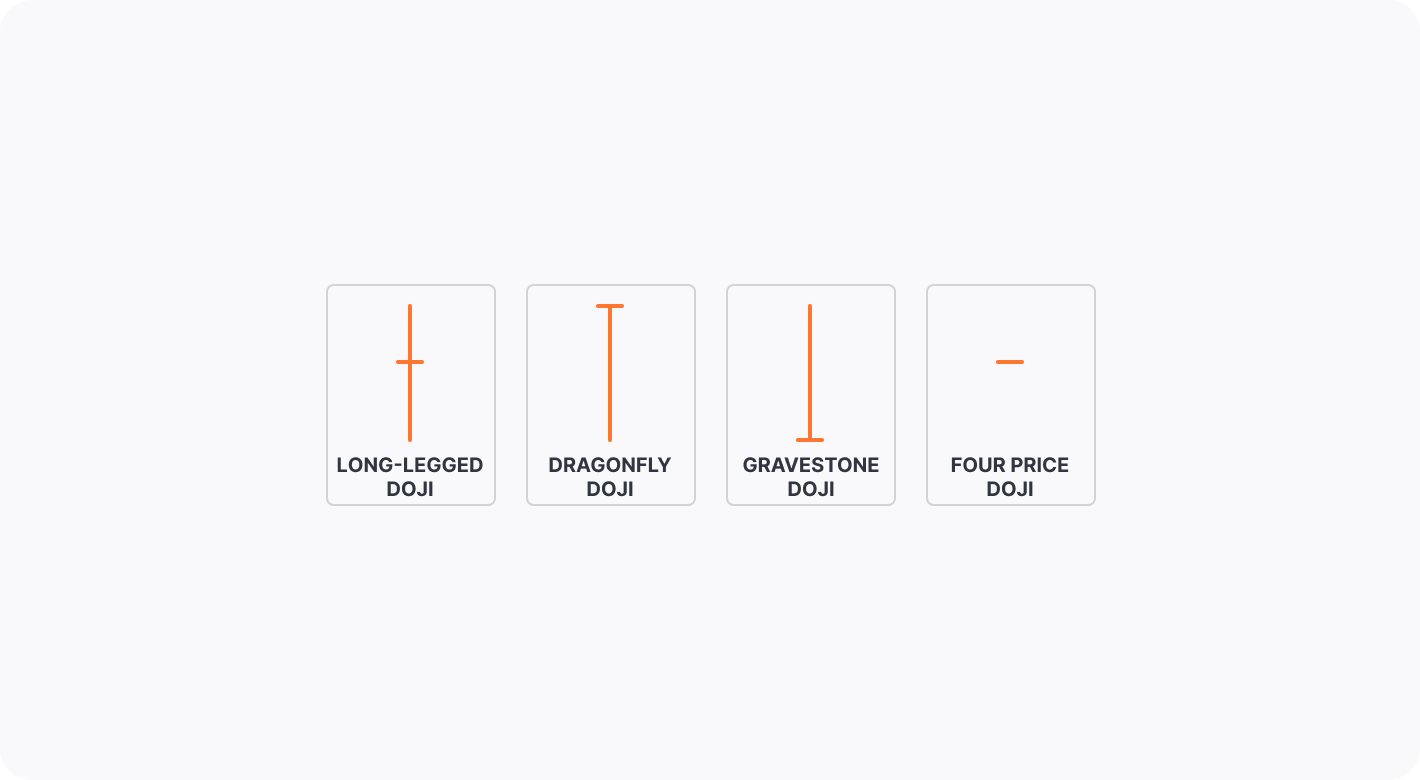
There are four types of Doji:
- A long-legged Doji is a sign that buyers and sellers are struggling to take control of the market.
- A Dragonfly Doji candle appears when bears try to pull the price, but they are weak. At the end of a downtrend, the candle signals a potential reversal.
- A Gravestone Doji candlestick is the opposite of the Dragonfly. It is formed when bulls are weak. Appearing at the end of an uptrend, it predicts its potential reversal.
- A four-price Doji is a candle of an illiquid market when open, close, high, and low prices are equal or almost equal.
Spinning Top
A spinning top resembles a Doji candle, but its open and close prices aren’t equal. It always has a body, but it must be short. A short body reflects the weakness of buyers and sellers.
- In a solid bullish trend, a spinning top candle usually shows that buyers aren’t strong anymore, and the trend may reverse down soon.
- In a downtrend, a spinning top candlestick alerts viewers that sellers aren’t strong anymore. Therefore, the price may turn up soon.
Japanese Candlestick Patterns
These were general rules. There are also some specific patterns that form the basis of Japanese candlestick trading. The patterns can be divided into two groups: reversal and continuation. The former appears at the end of a particular trend, while the latter signals a persistent price movement.
The rising three methods, the three-line strike, and the Tasuki gap are considered effective continuation patterns. Commonly used reversal patterns are the hanging man, the hammer, three white soldiers, and three black crows. Every Forex Japanese candlestick pattern has its own rules for entering and exiting a trade.
Summing Up
Japanese candlesticks provide traders with helpful information on current and future market conditions. They can be used not only in Forex; you can apply Japanese candles for stock, commodity, and crypto* charts. Try a free demo account at FXOpen to examine how candlesticks work.
*At FXOpen UK, Cryptocurrency CFDs are only available for trading by those clients categorised as Professional clients under FCA Rules. They are not available for trading by Retail clients
This article represents the opinion of the Companies operating under the FXOpen brand only. It is not to be construed as an offer, solicitation, or recommendation with respect to products and services provided by the Companies operating under the FXOpen brand, nor is it to be considered financial advice.
Stay ahead of the market!
Subscribe now to our mailing list and receive the latest market news and insights delivered directly to your inbox.

Latest articles

Dow Jones (DJIA): Consolidation Beyond the Trend
Federal Reserve Chair Kevin Warsh testified before Congress on 14–15 July, reaffirming the Fed's commitment to bringing inflation back to target while providing no clear guidance on the future path of interest rates. Meanwhile, June inflation data came in

European Currencies Strengthen Ahead of Key Macroeconomic Releases
EUR/USD and GBP/USD continue to recover moderately following the recent weakening of the US dollar. European currencies have been supported by expectations that US inflationary pressures will continue to ease after softer-than-expected CPI and PPI data, reinforcing market

Brent Crude Oil: From Ceasefire to Crossfire — What's Next?
Just weeks ago, traders were pricing in peace. Now they're pricing in war again—and that reversal says everything about how fragile the current Middle East calm really is.
Brent crude has surged to $86 a barrel, its highest level