


Accumulative Swing Index: Definition and How to Use It
FXOpen
While many traders opt for moving averages to decipher market movements, some prefer the Accumulative Swing Index. This tool helps traders gauge trends at-a-glance and offers some fairly versatile setups. In this article, we will unpack its intricacies, from its foundational formulas to practical applications and limitations.
What Is the Accumulative Swing Index?
Building on the swing index by J. Welles Wilder, the Accumulative Swing Index (ASI) is a technical analysis tool used to assess the overall trend strength and direction of a market. The ASI cumulatively sums swing values to provide traders with a broader perspective on market movements.
By aggregating these values over time, the ASI offers a clearer picture of whether a market is trending upwards or downwards. While individual swing index values capture short-term fluctuations, the ASI smoothes out these values, allowing traders to discern sustained trends and potential price reversals.
How Is the ASI Calculated?
The Accumulative Swing Index is determined by the sum of the Swing Index (SI) values over a specified period. Calculating the SI is a crucial first step, which uses the following formula:
SI= 50×(C−CP+0.5×(CP−OP)+0.25×(C−O))/R
Where:
C = Current closing price
CP = Previous period's closing price
O = Current opening price
OP = Previous period's opening price
R = Maximum of [(High - C), (Low - C), (High - CP), (Low - CP)]
Once the SI value for a specific period is computed, it's added to the prior period's ASI to calculate the current ASI:
ASI = Previous ASI + SI
The result is a line plotted below the chart that guides traders on the direction and momentum of the market.
At FXOpen, our free trading platform already offers the Accumulative Swing Index, meaning you don’t need to bother with performing these calculations yourself. Head over to TickTrader to get started.
ASI vs SI: How Does It Compare With the Swing Index?
The distinction between the Accumulative Swing Index and the Swing Index lies primarily in their temporal scope and application. SI, as formulated by J. Welles Wilder, is a single-period indicator focusing on the immediate price actions from one trading session to the next. It provides a snapshot, capturing short-term price dynamics, which can be pivotal for intraday traders or those seeking quick market insights.
Conversely, ASI is the running total of these SI values. By continuously summing up the Swing Index values, the ASI offers a longer-term perspective, tracing the market's momentum and direction over extended periods. It's like comparing a photograph (SI) to a movie (ASI). The SI captures a moment while the ASI narrates the entire story.
For traders, this distinction is vital. SI offers quick insights for short-term decisions, while ASI provides a bird's-eye view, which is crucial for understanding overarching market trends.
How to Trade Using the Accumulative Swing Index
Using the Accumulative Swing Index in a trading strategy can help enhance your decision-making processes. Here's how traders often harness the power of ASI:
Trend Identification
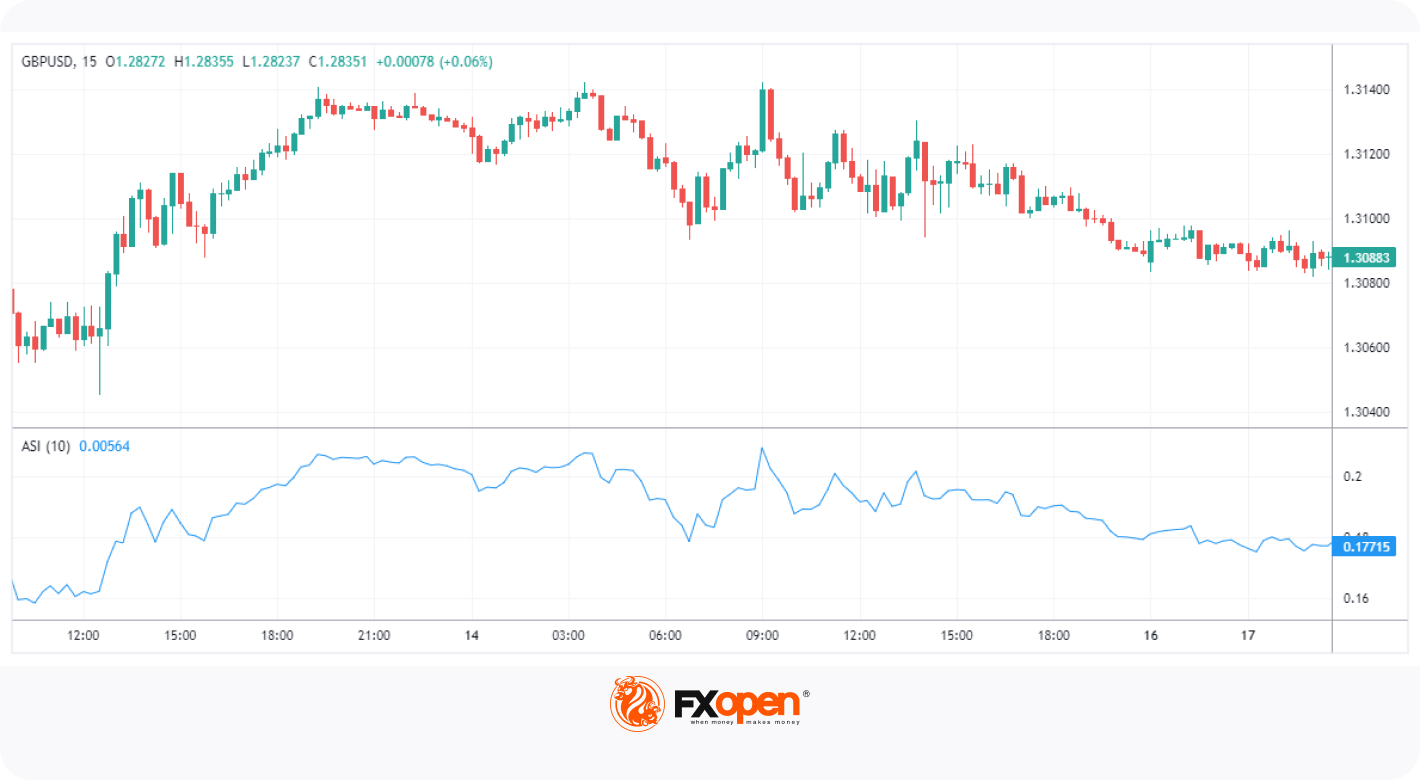
Begin by observing the ASI line. A rising ASI suggests an upward trend, indicating potential buy opportunities. Conversely, a declining ASI indicates a bearish trend, signalling a potential sell stance. The key lies in confirming the trend over multiple periods to ensure its robustness.
Divergence Analysis
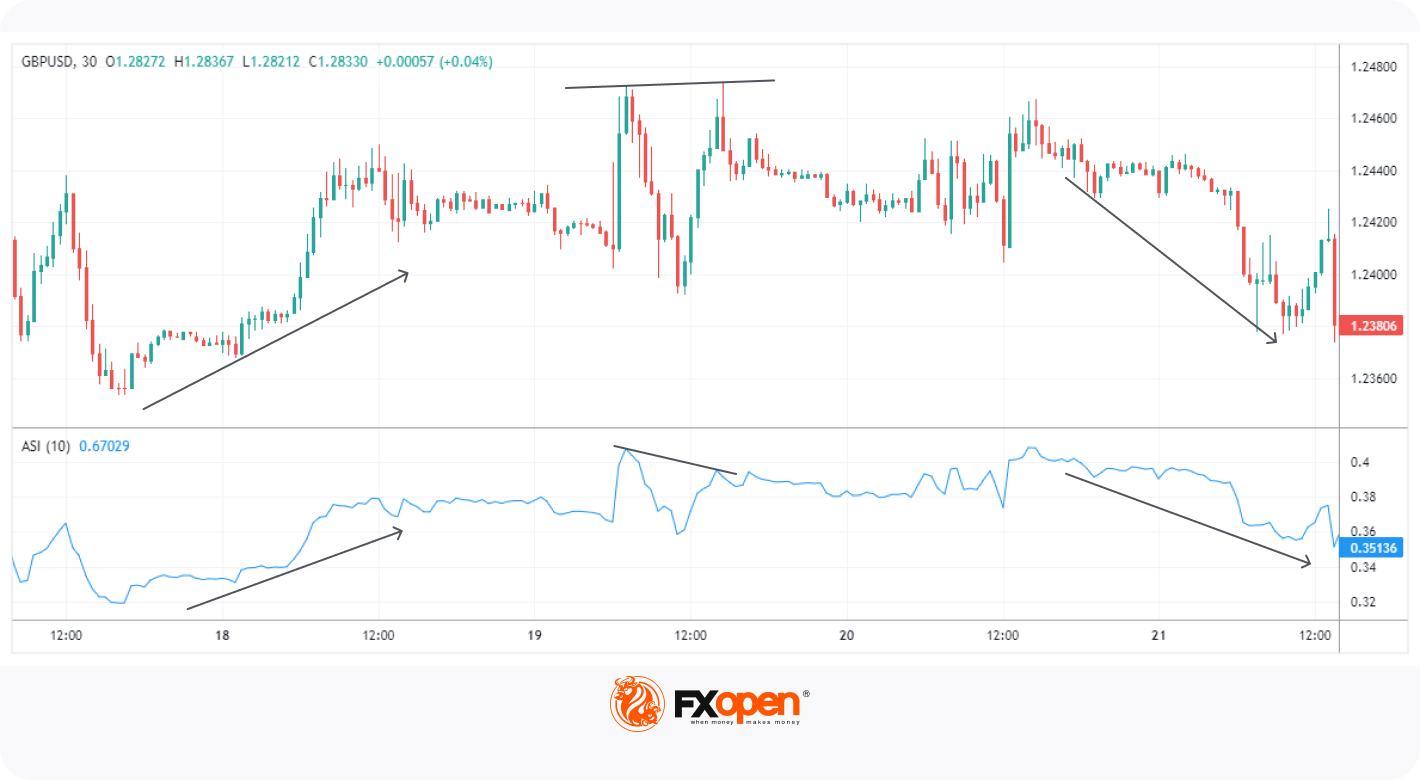
A divergence occurs when the price chart and the ASI chart move in opposite directions. If the market price is making new highs, but the ASI isn’t following suit, it could indicate a weakening upward trend, signalling a potential price reversal. Conversely, if the market price drops to new lows without a corresponding low in the ASI, a bullish reversal might be on the horizon.
Breakout Confirmation
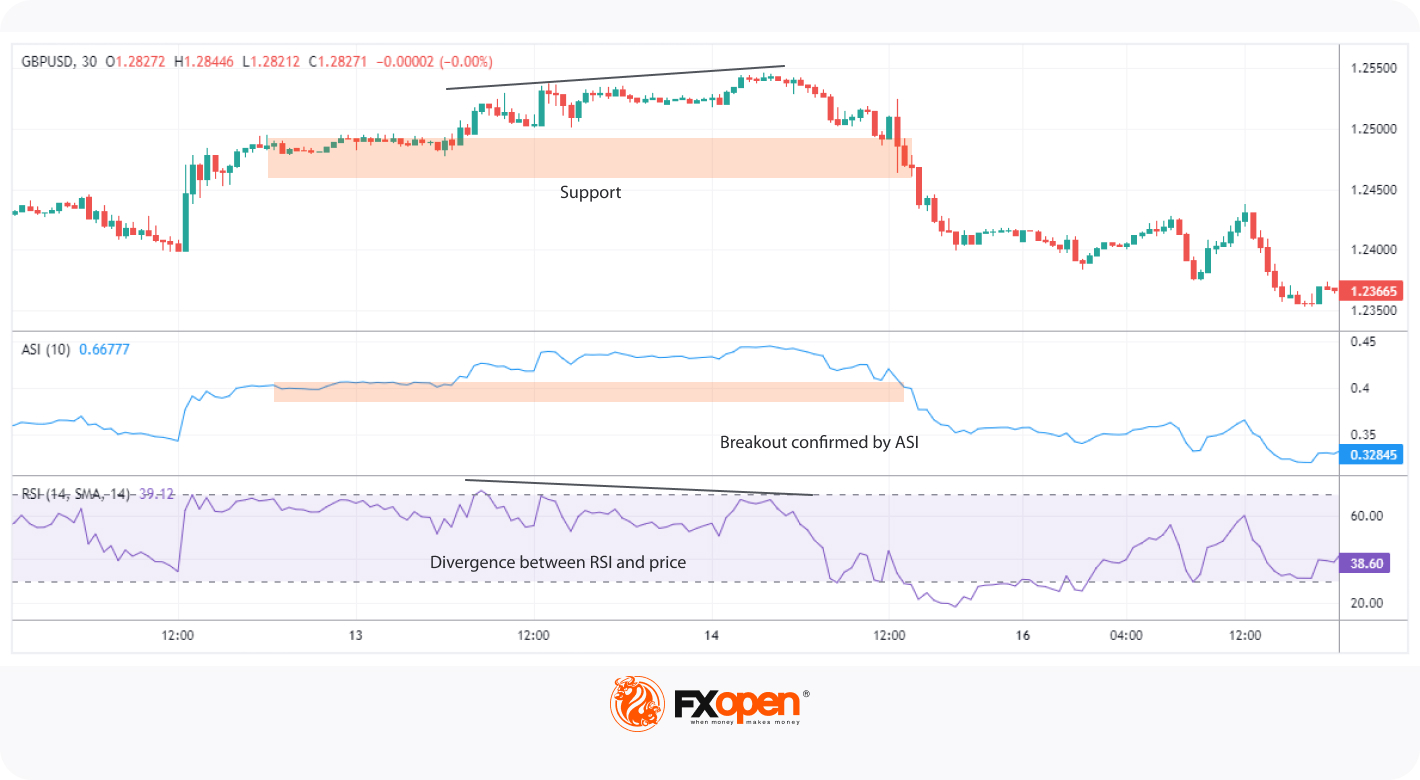
The ASI can validate breakout scenarios. For instance, if the price breaks through a long-term resistance level and the ASI simultaneously hits new highs, it reinforces the breakout's legitimacy. Such synchronous movements can boost trader confidence in entering a position.
Limitations of the Accumulative Swing Index Indicator
While using the Accumulative Swing Index for technical analysis can be valuable, it's not infallible. Firstly, as with many indicators like the Accumulative Swing Index, it may occasionally produce false signals and lead traders astray, especially in highly volatile markets.
Additionally, relying solely on ASI without cross-referencing with other indicators can result in an incomplete market picture. Pairing the indicator with another that measures a different aspect of the market, like the RSI or MACD, can provide more holistic trade signals and reduce false positives.
The Bottom Line
In summary, the ASI is a powerful tool, translating intricate market movements into comprehensible insights for traders. With its ability to provide both a snapshot and a prolonged view of the market, it complements other indicators and has a place in a well-rounded trading strategy.
With this newfound knowledge under your belt, you might be ready to put it into practice. If you are, you can open an FXOpen account to use it across a wide variety of markets, including forex, stocks, and commodities, and benefit from a partnership with Traders Union’s Most Innovative Broker of 2022. Happy trading!
This article represents the opinion of the Companies operating under the FXOpen brand only. It is not to be construed as an offer, solicitation, or recommendation with respect to products and services provided by the Companies operating under the FXOpen brand, nor is it to be considered financial advice.
Stay ahead of the market!
Subscribe now to our mailing list and receive the latest market news and insights delivered directly to your inbox.


Latest articles

EUR/JPY: Yen Recovers April Losses as the Market Searches for a New Equilibrium
Fundamental backdrop
In late April 2026, Japan’s Ministry of Finance moved from verbal warnings to direct action, carrying out a currency intervention worth roughly ¥5.5 trillion ($35 billion) — the first since July 2024. The move was triggered by

Market Analysis: GBP/USD Turns Bullish Again While EUR/GBP Drops More
GBP/USD is showing positive signs above 1.3440 and 1.3460. EUR/GBP declined and is now consolidating losses below 0.8680.
Important Takeaways for GBP/USD and EUR/GBP Analysis Today
· The British Pound started a fresh increase

Netflix 2026: Reversal on the Deal, Pullback on Earnings
Fundamental Background
At the end of February, Netflix withdrew from the bid for Warner Bros. Discovery assets after WBD’s board deemed Paramount Skydance’s $31-per-share offer more attractive. Netflix chose not to raise its own bid of $27.75