


FXOpen

AUD/USD surged above the 0.6800 and 0.6850 levels. NZD/USD is also rising and might aim for more gains above 0.6300.
Important Takeaways for AUD USD and NZD USD Analysis Today
· The Aussie Dollar rallied after forming a base above the 0.6750 level against the US Dollar.
· There is a key bullish trend line forming with support at 0.6860 on the hourly chart of AUD/USD at FXOpen.
· NZD/USD is consolidating gains from the 0.6350 zone.
· There is a major bullish trend line forming with support at 0.6280 on the hourly chart of NZD/USD at FXOpen.
AUD/USD Technical Analysis
On the hourly chart of AUD/USD at FXOpen, the pair started a fresh increase from the 0.6750 support. The Aussie Dollar was able to clear the 0.6800 resistance to move into a positive zone against the US Dollar.
There was a close above the 0.6850 resistance and the 50-hour simple moving average. Finally, the pair tested the 0.6900 zone. A high was formed near 0.6908 and the pair recently saw a minor pullback.
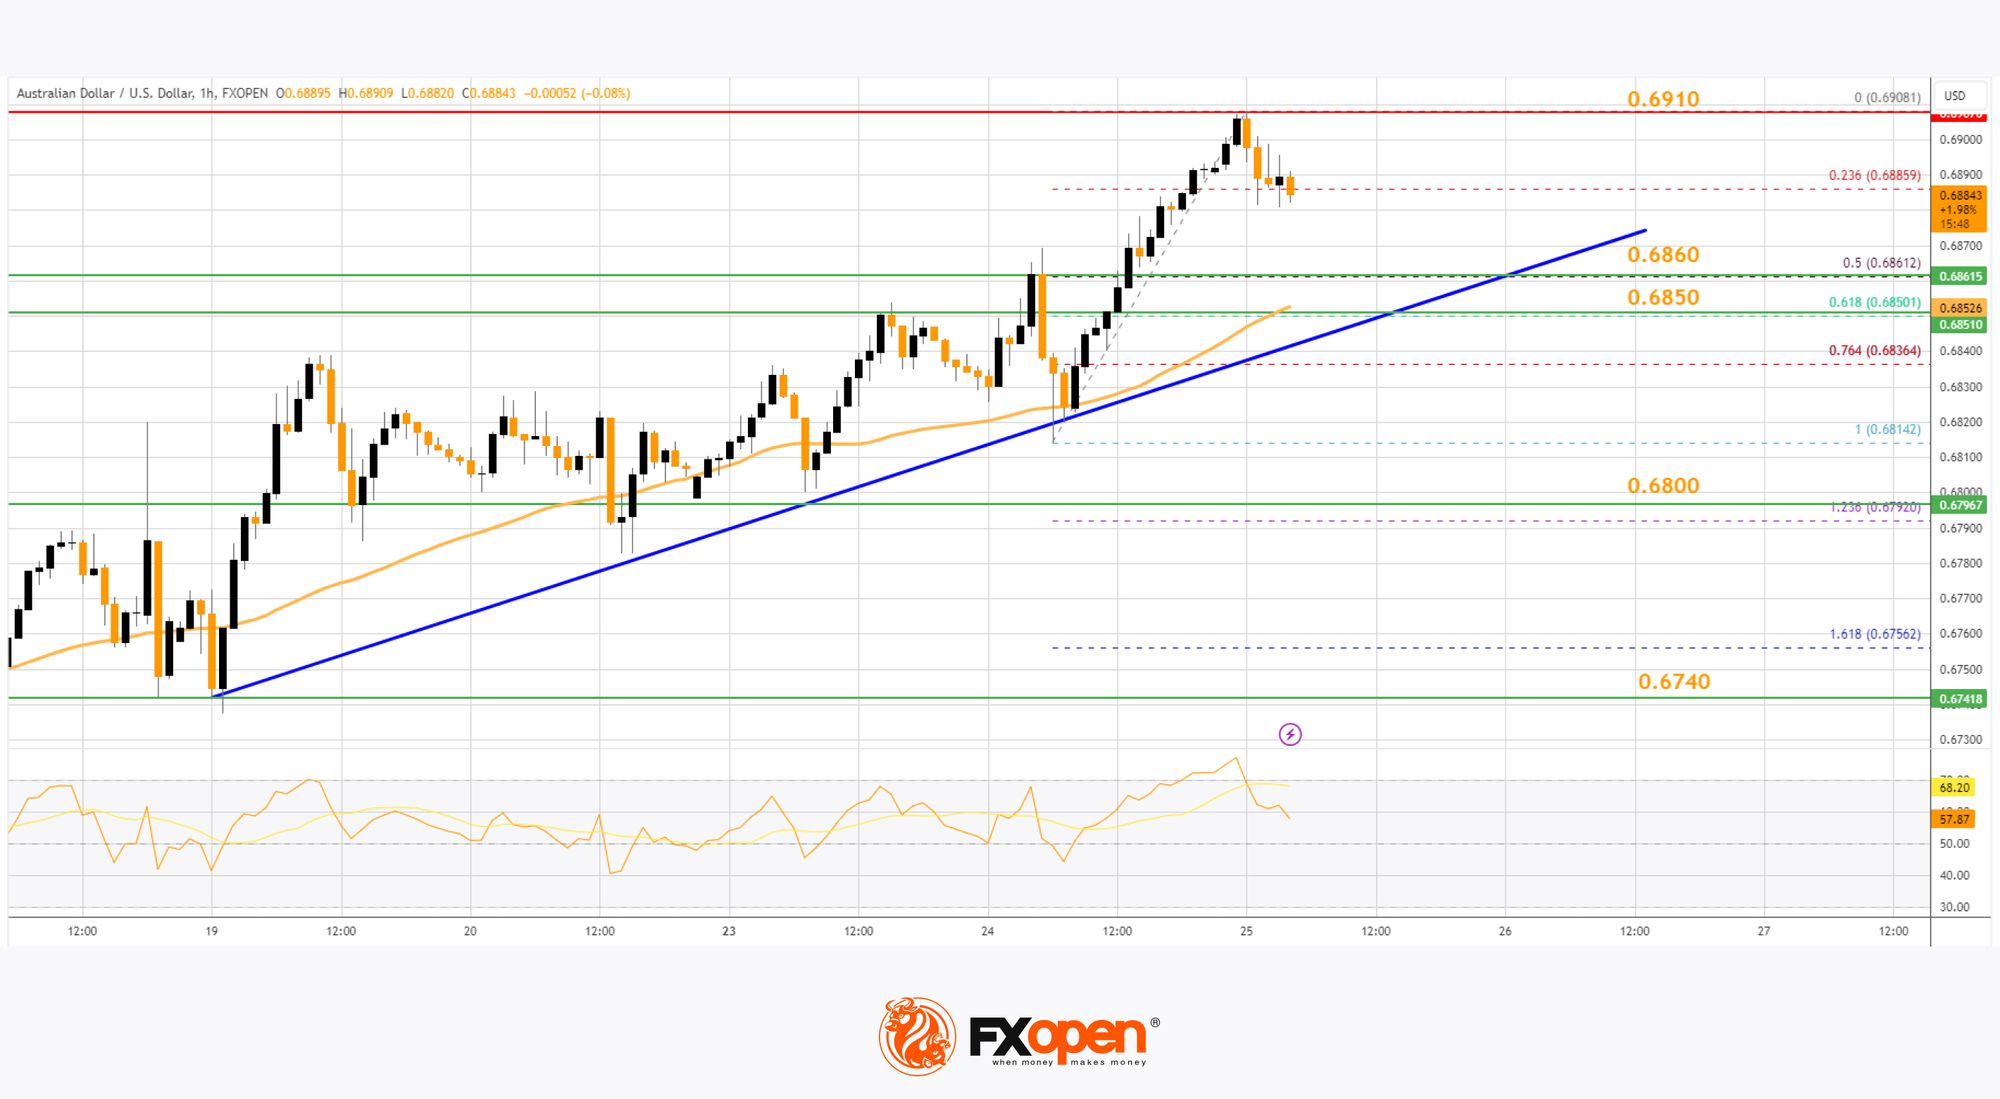
There was a move below the 0.6900 level. The pair declined below the 23.6% Fib retracement level of the upward move from the 0.6814 swing low to the 0.6908 high. On the downside, initial support is near a key bullish trend line at 0.6860.
The next major support is near the 61.8% Fib retracement level of the upward move from the 0.6814 swing low to the 0.6908 high at 0.6850 and the 50-hour simple moving average.
If there is a downside break below the 0.6850 support, the pair could extend its decline toward the 0.6800 level. Any more losses might signal a move toward 0.6740.
On the upside, the AUD/USD chart indicates that the pair is now facing resistance near 0.6910. The first major resistance might be 0.6925. An upside break above the 0.6925 resistance might send the pair further higher.
The next major resistance is near the 0.6980 level. Any more gains could clear the path for a move toward the 0.7000 resistance zone.
NZD/USD Technical Analysis
On the hourly chart of NZD/USD on FXOpen, the pair started a steady increase from the 0.6180 zone. The New Zealand Dollar broke the 0.6265 resistance to start the recent increase against the US Dollar.
The pair settled above 0.6280 and the 50-hour simple moving average. It tested the 0.6355 zone and is currently correcting gains. The pair corrected lower below the 0.6340 level. The NZD/USD chart suggests that the RSI is now approaching 60.
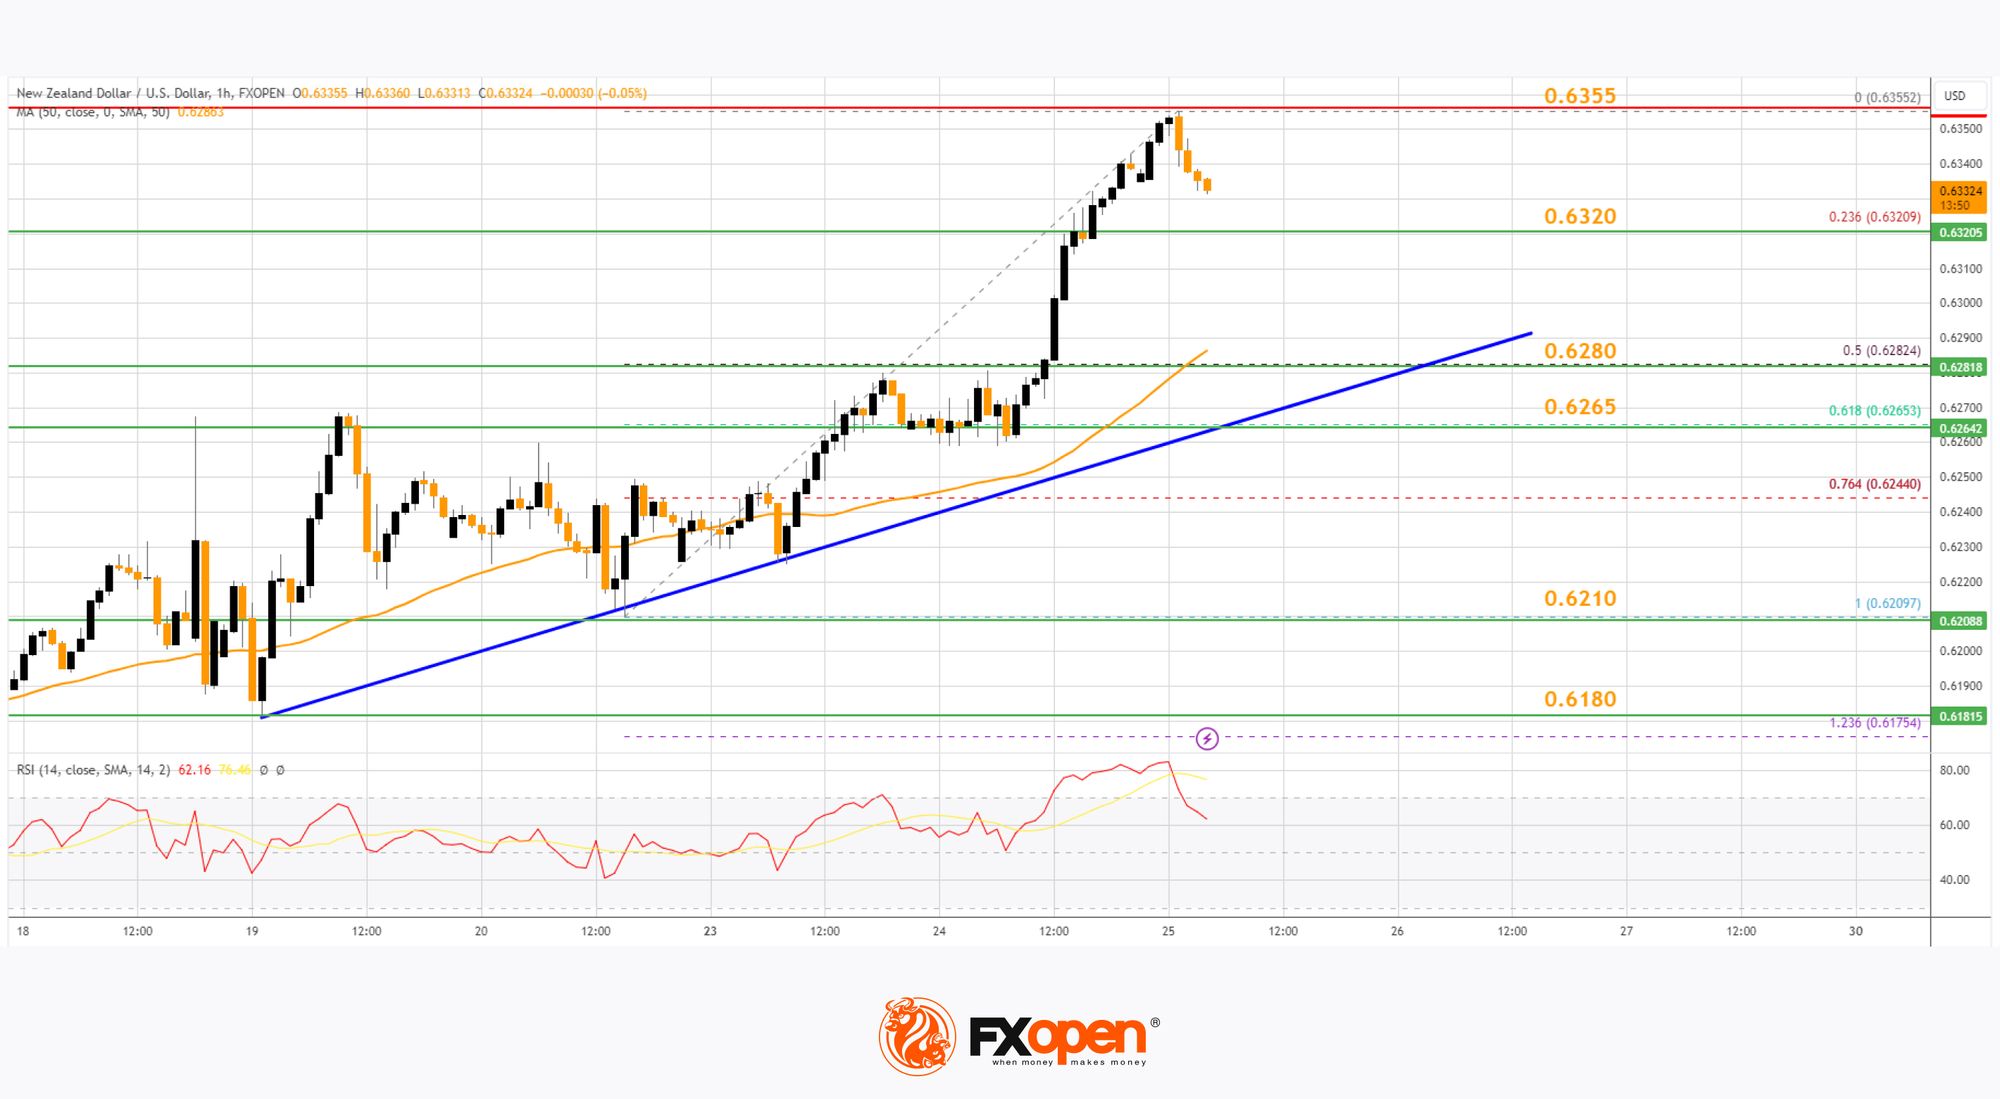
On the downside, immediate support is near the 23.6% Fib retracement level of the upward wave from the 0.6209 swing low to the 0.6355 high at 0.6320.
The first key support is near a trend line at 0.6280 and the 50% Fib retracement level of the upward wave from the 0.6209 swing low to the 0.6355 high. It is close to the 50-hour simple moving average. The next major support is near the 0.6265 level.
If there is a downside break below the 0.6265 support, the pair might slide toward the 0.6210 support. Any more losses could lead NZD/USD in a bearish zone to 0.6180.
On the upside, the pair might struggle near 0.6355. The next major resistance is near the 0.6380 level. A clear move above the 0.6380 level might even push the pair toward the 0.6440 level. Any more gains might clear the path for a move toward the 0.6500 resistance zone in the coming days.
Trade over 50 forex markets 24 hours a day with FXOpen. Take advantage of low commissions, deep liquidity, and spreads from 0.0 pips. Open your FXOpen account now or learn more about trading forex with FXOpen.
This article represents the opinion of the Companies operating under the FXOpen brand only. It is not to be construed as an offer, solicitation, or recommendation with respect to products and services provided by the Companies operating under the FXOpen brand, nor is it to be considered financial advice.
Stay ahead of the market!
Subscribe now to our mailing list and receive the latest market news and insights delivered directly to your inbox.


Latest articles

Natural Gas Prices Fell in Late December
On 4 December, while analysing the XNG/USD chart, we highlighted the rally in natural gas prices towards a three-year high and noted that the price had entered a resistance zone formed by:
→ the upper boundary of a broad descending


Gold Price Analysis: Price Retreats From Record Highs
As the XAU/USD chart shows, gold rallied yesterday to near its October all-time high around the 4,380 level, before pulling back (as indicated by the arrow).
The surge in volatility was driven by a combination of factors:
→ Expectations