


FXOpen

GBP/USD started a downside correction from 1.3700. USD/CAD is gaining bullish momentum and might clear 1.3640 for more upside.
Important Takeaways for GBP/USD and USD/CAD Analysis Today
· The British Pound rallied toward 1.3700 before the bears appeared.
· There is a declining channel forming with support near 1.3585 on the hourly chart of GBP/USD at FXOpen.
· USD/CAD is showing positive signs above the 1.3555 support zone.
· There was a break above a key bearish trend line with resistance at 1.3555 on the hourly chart at FXOpen.
GBP/USD Technical Analysis
On the hourly chart of GBP/USD at FXOpen, the pair gained pace for a move toward 1.3700, as discussed in the previous analysis. The British Pound failed to stay above 1.3700 and started a downside correction below 1.3660 against the US Dollar.
The pair traded below 1.3630, the 50-hour simple moving average, and the 50% Fib retracement level of the upward move from the 1.3508 swing low to the 1.3712 high.
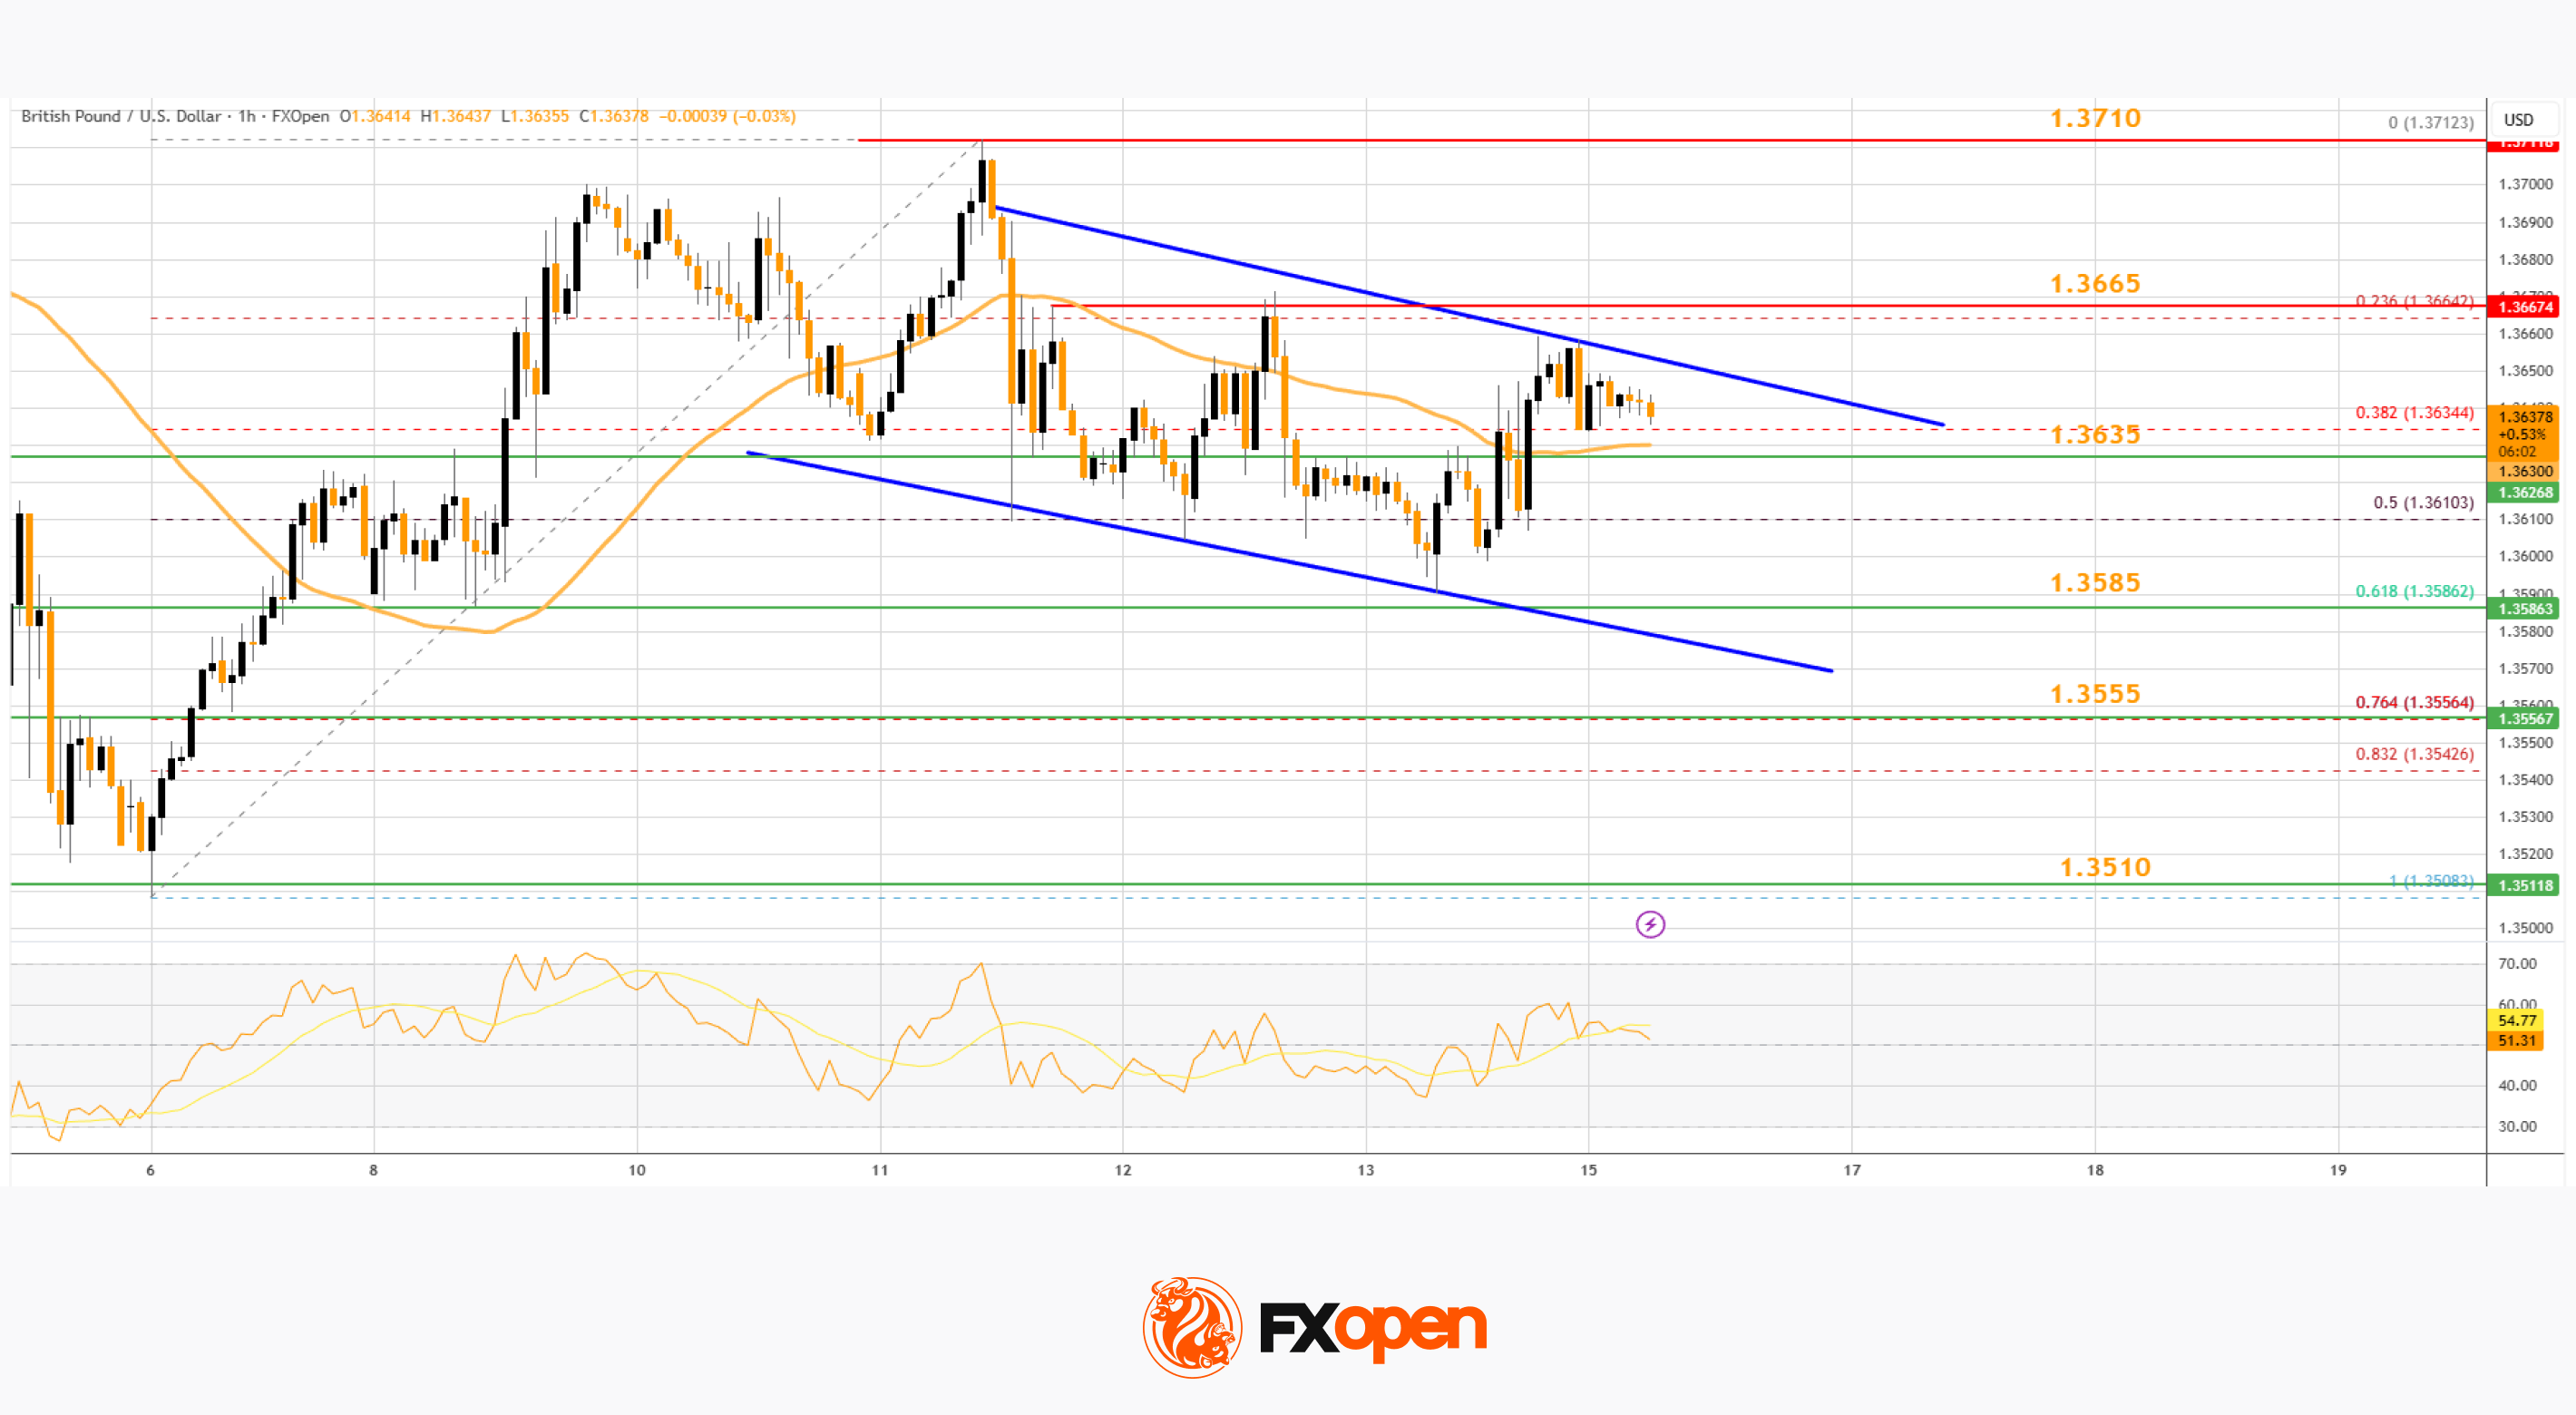
Finally, the bulls appeared near 1.3600, and the pair trimmed some losses. It is back above 1.3630 and the 50-hour simple moving average. Immediate hurdle on the upside is near 1.3665.
The first major resistance is 1.3710. The main sell zone sits at 1.3740. A close above 1.3740 might spark a steady upward move. The next stop for the bulls might be near 1.3800. Any more gains could lead the pair toward 1.3880 in the near term.
If there is a fresh decline, initial bid zone on the GBP/USD chart sits at 1.3635. The next major area of interest could be 1.3585. There is also a declining channel forming with support near 1.3585, below which there is a risk of another sharp decline. In the stated case, the pair could drop toward 1.3510.
USD/CAD Technical Analysis
On the hourly chart of USD/CAD at FXOpen, the pair formed a strong base above 1.3500. The US Dollar started a fresh increase above 1.3540 and 1.3550 against the Canadian Dollar.
More importantly, there was a break above a key bearish trend line with resistance at 1.3555. The pair even climbed above the 50% Fib retracement level of the downward move from the 1.3724 swing high to the 1.3504 low.
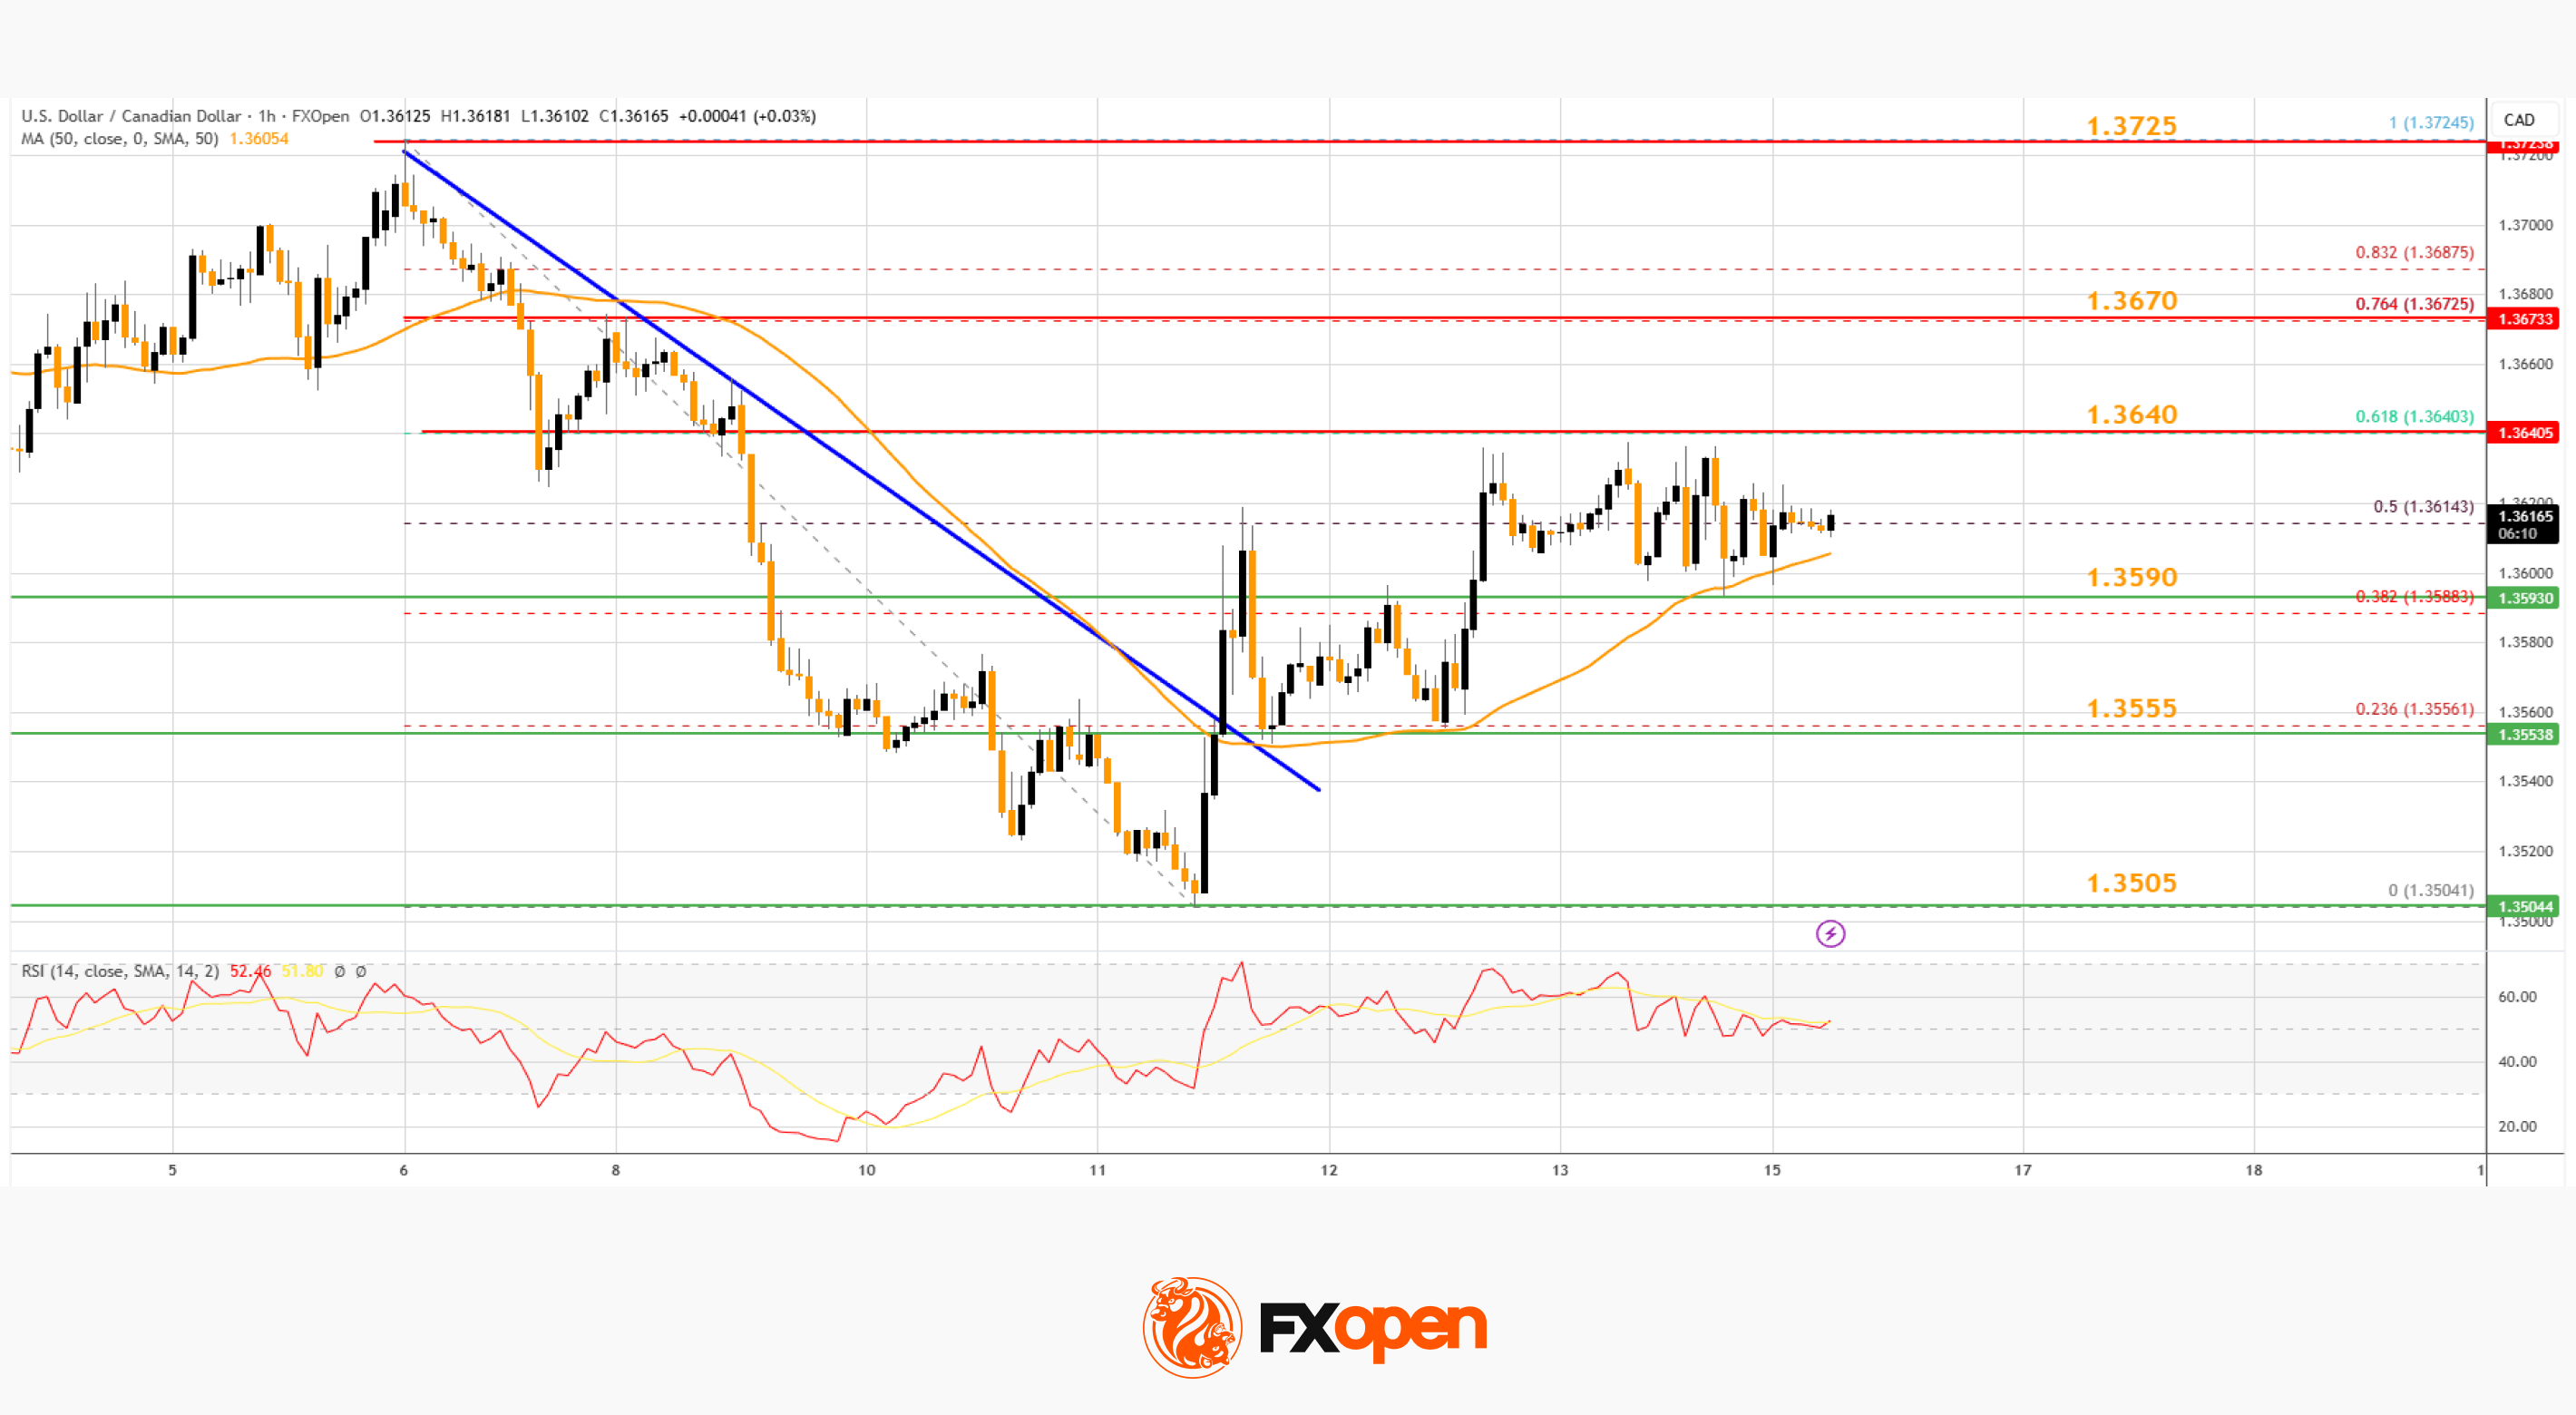
The pair is now consolidating above the 50-hour simple moving average. If there is another increase, the pair might face hurdles near 1.3640 and the 61.8% Fib retracement.
A clear upside break above 1.3640 could start another steady increase. In the stated case, the pair could test 1.3725. A close above 1.3725 might send the pair toward 1.3800. Any more gains could open the doors for a test of 1.3920.
Initial support is near the 50-hour simple moving average and 1.3590. The next key breakdown zone could be 1.3555. The main hurdle for the bears might be 1.3505 on the same USD/CAD chart.
A downside break below 1.3505 could push the pair further lower. The next key area of interest might be 1.3465, below which the pair might visit 1.3420.
Trade over 50 forex markets 24 hours a day with FXOpen. Take advantage of low commissions, deep liquidity, and spreads from 0.0 pips (additional fees may apply). Open your FXOpen account now or learn more about trading forex with FXOpen.
This article represents the opinion of the Companies operating under the FXOpen brand only. It is not to be construed as an offer, solicitation, or recommendation with respect to products and services provided by the Companies operating under the FXOpen brand, nor is it to be considered financial advice.
Stay ahead of the market!
Subscribe now to our mailing list and receive the latest market news and insights delivered directly to your inbox.


Latest articles

Market Insights with Gary Thomson: Where Are Oil, Gas & Global Indices Heading?
In this video, we’ll explore the key economic events and market trends, shaping the financial landscape. Get ready for insights into financial markets to help you navigate the week ahead. Let’s dive in!
In this episode of Market

Netflix (NFLX) Shares Pull Back After a 30% Surge
On 21 January, while analysing the NFLX chart, we:
→ identified a descending channel and a resistance zone around the $100 level;
→ noted that Netflix shares were showing a sustained downtrend. Selling pressure had been triggered primarily by reports of a

US Dollar Index (DXY) Rises Above the 100 Level
Today the US Dollar Index (DXY) climbed above the psychological 100 mark for the first time in 2026, supported by a tense fundamental backdrop, with the military conflict in the Middle East acting as the main driver.
→ Financial market participants