


Market Analysis: Gold and WTI Crude Oil Prices Regain Momentum
FXOpen

Gold price started a fresh increase above the $2,665 resistance level. WTI Crude oil prices climbed higher above $77.00 and might extend gains.
Important Takeaways for Gold and WTI Crude Oil Prices Analysis Today
· Gold price started a steady increase from the $2,630 zone against the US Dollar.
· It cleared a key bearish trend line with resistance at $2,670 on the hourly chart of gold at FXOpen.
· WTI Crude oil prices extended gains above the $74.40 and $76.50 resistance levels.
· There is a short-term declining channel forming with support at $76.00 on the hourly chart of XTI/USD at FXOpen.
Gold Price Technical Analysis
On the hourly chart of Gold at FXOpen, the price formed a base near the $2,630 zone. The price started a steady increase above the $2,650 and $2,665 resistance levels.
There was a decent move above the 50-hour simple moving average and $2,680. The bulls pushed the price above the $2,690 resistance zone. Finally, the bears appeared near $2,700. A high was formed near $2,697 before there was a downside correction.
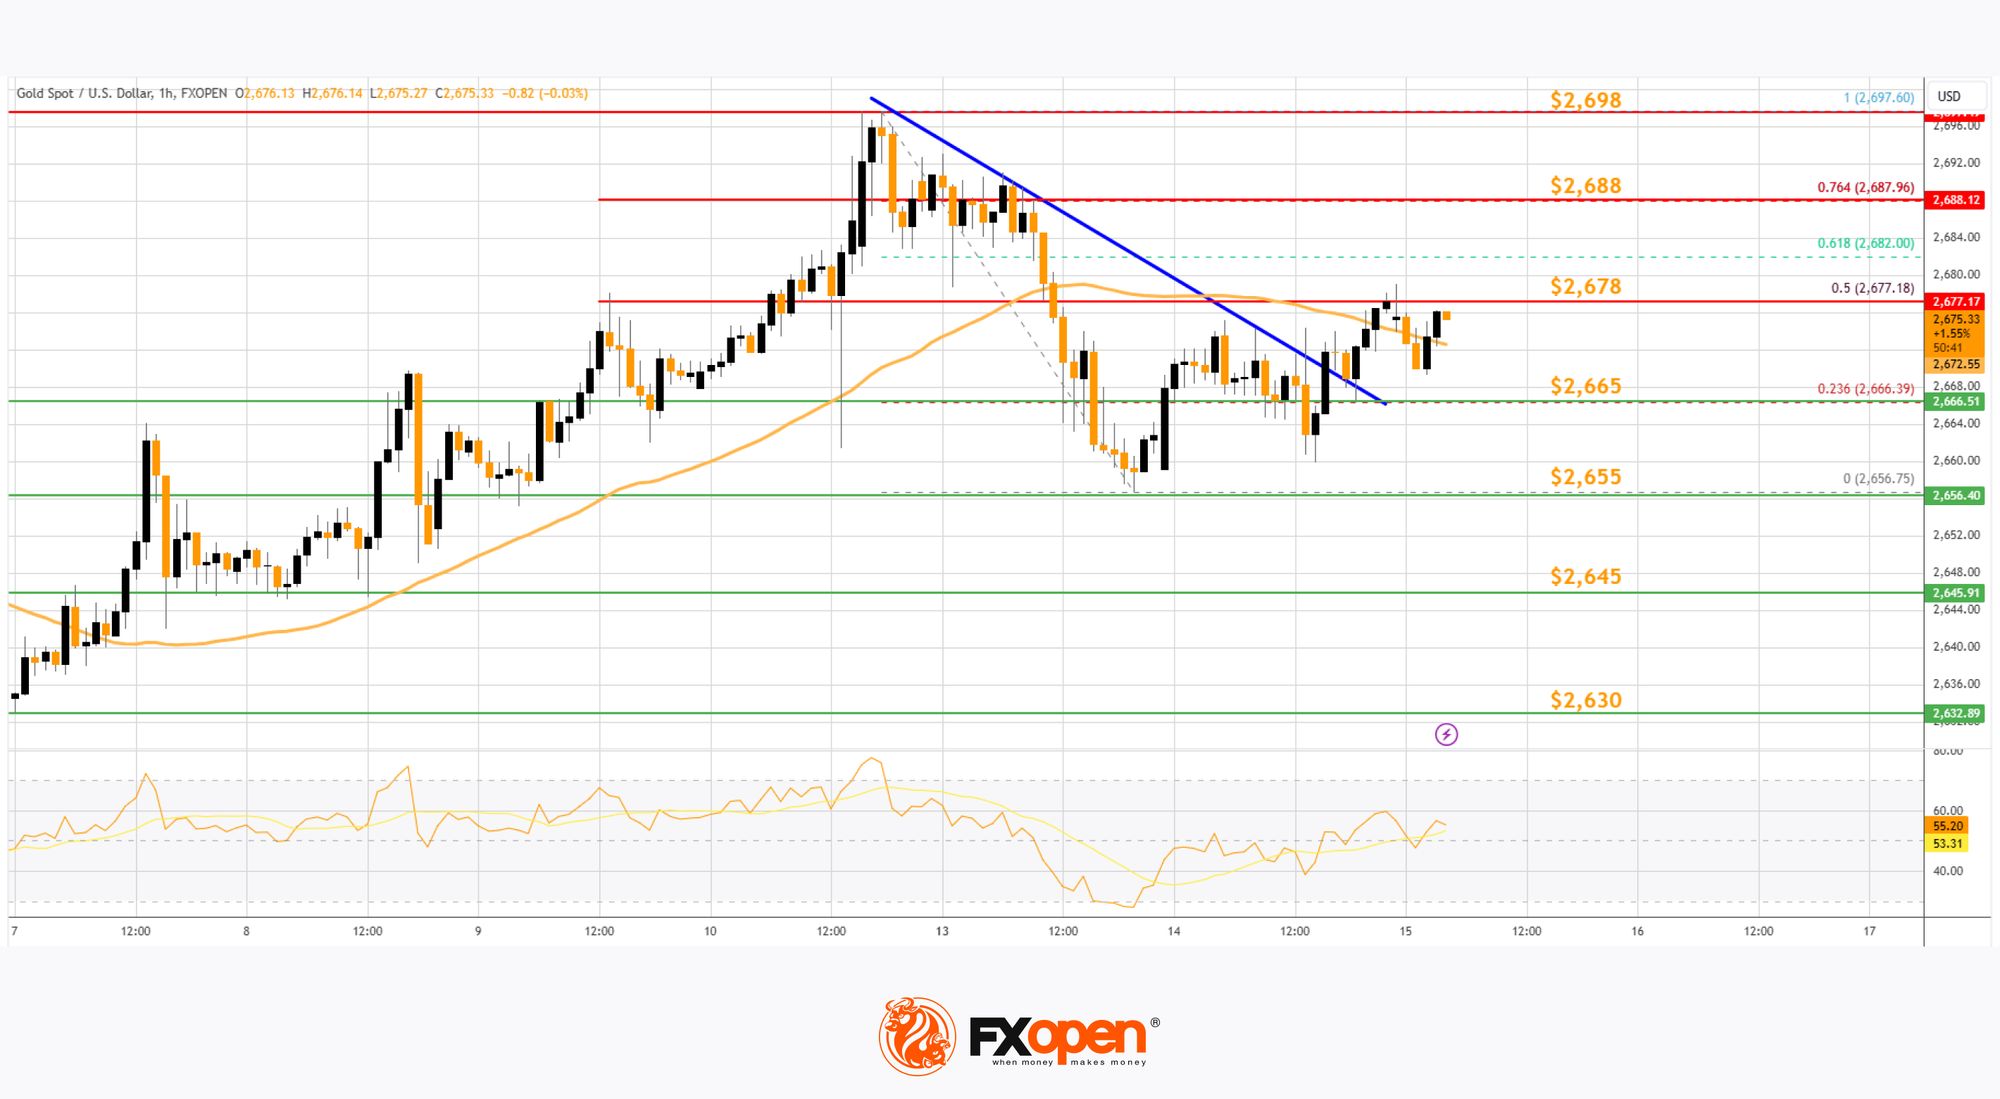
A low was formed at $2,656 and the price is again rising. There was a move above the 23.6% Fib retracement level of the downside correction from the $2,697 swing high to the $2,656 low.
Gold cleared a key bearish trend line with resistance at $2,670. The RSI is now above 50 and the price is now facing hurdles. Immediate resistance is near the $2,678 level or the 50% Fib retracement level of the downside correction from the $2,697 swing high to the $2,656 low.
The next major resistance is near the $2,688 level. An upside break above the $2,688 resistance could send Gold price toward $2,698. Any more gains may perhaps set the pace for an increase toward the $2,720 level.
On the downside, immediate support is near the $2,665 level. The next major support sits at $2,655, below which the price might test $2,645. Any more losses might send the price toward the $2,630 support zone.
Oil Price Technical Analysis
On the hourly chart of WTI Crude Oil at FXOpen, the price started a major upward move from $72.30 against the US Dollar. The price gained bullish momentum after it broke the $75.00 resistance and the 50-hour simple moving average.
The bulls pushed the price above the $76.50 and $77.00 resistance levels. The recent high was formed at $77.82 and the price started a downside correction. There was a minor move toward the 23.6% Fib retracement level of the upward move from the $72.32 swing low to the $77.82 high.
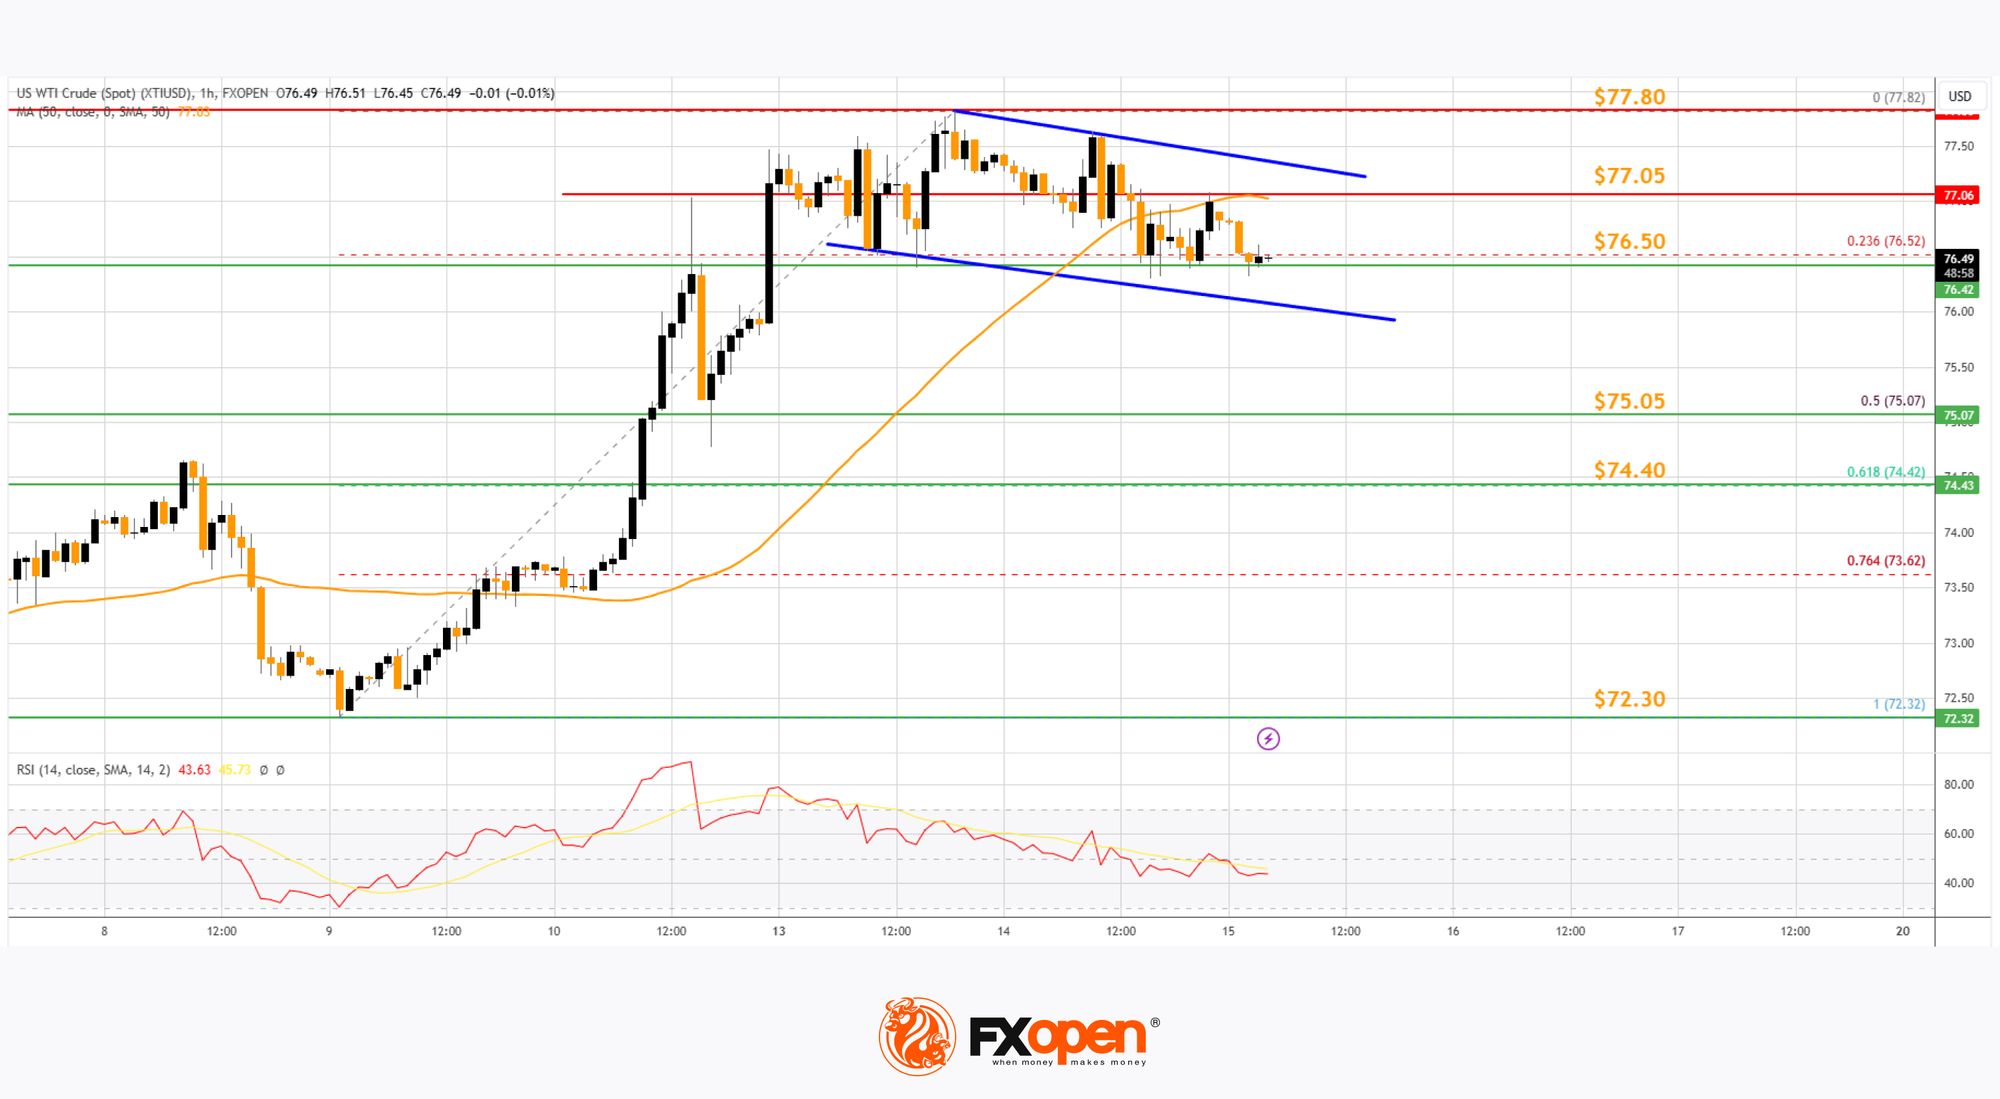
The RSI is now below the 50 level and there is a short-term declining channel forming with support at $76.00. Immediate support on the downside is near the $76.50 zone.
The next major support on the WTI crude oil chart is near the $76.00 zone, below which the price could test the $75.05 level and the 50% Fib retracement level of the upward move from the $72.32 swing low to the $77.82 high.
If there is a downside break, the price might decline toward $74.50. Any more losses may perhaps open the doors for a move toward the $72.30 support zone.
If the price climbs higher again, it could face resistance near $77.05. The next major resistance is near the $77.80 level. Any more gains might send the price toward the $78.50 level.
Start trading commodity CFDs with tight spreads (additional fees may apply). Open your trading account now or learn more about trading commodity CFDs with FXOpen.
This article represents the opinion of the Companies operating under the FXOpen brand only. It is not to be construed as an offer, solicitation, or recommendation with respect to products and services provided by the Companies operating under the FXOpen brand, nor is it to be considered financial advice.
Stay ahead of the market!
Subscribe now to our mailing list and receive the latest market news and insights delivered directly to your inbox.


Latest articles

Weekly Market Insights with Gary Thomson: US Inflation, UK GDP, Chair Warsh Testimony, and Earnings
In this video, we’ll explore the key economic events and market trends, shaping the financial landscape. Get ready for insights into financial markets to help you navigate the week ahead. Let’s dive in!
In this episode of Market

GBP/AUD Analysis: The Tug-of-War Begins
Oil is back in the driver's seat, and both the pound and the aussie are feeling its grip. The Bank of England held rates at 3.75% in June, but with UK inflation at 2.8% and crude oil climbing

Australian Dollar Holds Above the Current Market Profile
The minutes from the Reserve Bank of Australia's (RBA) June meeting, released on 30 June, suggested that policymakers are not yet ready to rule out further policy tightening. Board members noted persistent excess demand and broad-based inflationary pressures across the