


Altcoins Continue Range-bound Trading
FXOpen
Most of the altcoin market continues to trade in a range. Peercoin is down by 1.3 cents compared to last Thursday while Namecoin is trading almost unchanged at $0.401 dollars per coin. The lull in market action is likely caused by bitcoin’s decreasing volatility. We’ve touched a bit on the reasons behind this in our recent article.
Peercoin Falls by 3 Percent
Alternative crypto-currency Peercoin is trading lower by 3 percent this week. On the chart below we can see that after a brief spike last Thursday, PPC/USD has resumed the slow downward slide. But what we said in last week’s article continues to apply, we’re nowhere near the two important breakout points for PPC.
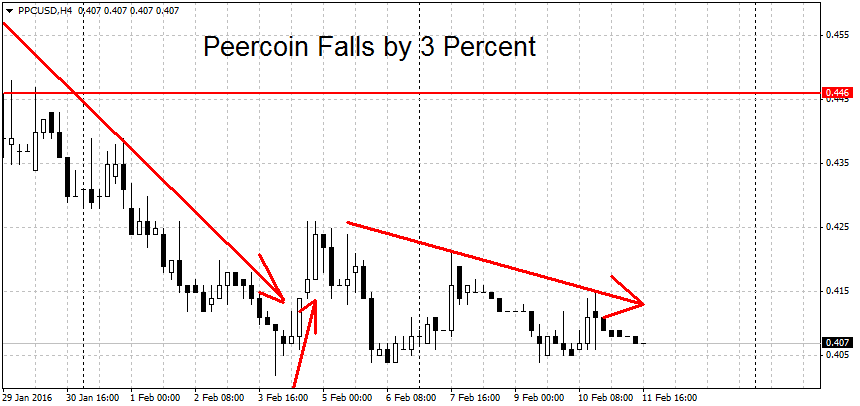
To start a new rally, the bulls will need to break the round 50 cents figure. Below here we have two resistance levels at $0.483 and $0.495. Both of these are former swing highs in PPC/USD. If the key $0.50 level is broken, we could see an extended move towards $0.579 dollars per coin. Higher up more resistance can be found at $0.616 followed by the parity $1 level and last July’s spike high at $1.02 dollars per coin.
On the downside, the hurdle to starting a new downtrend lies at the $0.385 dollars level. A decisive break below here could lead to more losses toward the $0.353 swing low. Below here we can find more support at $0.333 and $0.321 dollars, followed by a strong support area stretching from $0.29 to $0.30 dollars.
Namecoin Barely Changed
Namecoin has been trading in a relatively tight range during the past two weeks. We are currently quoted at $0.401, only $0.6 of a cent below last week’s prices. As we can see on the chart below, prices continue to linger in the area around the 40 cents level.
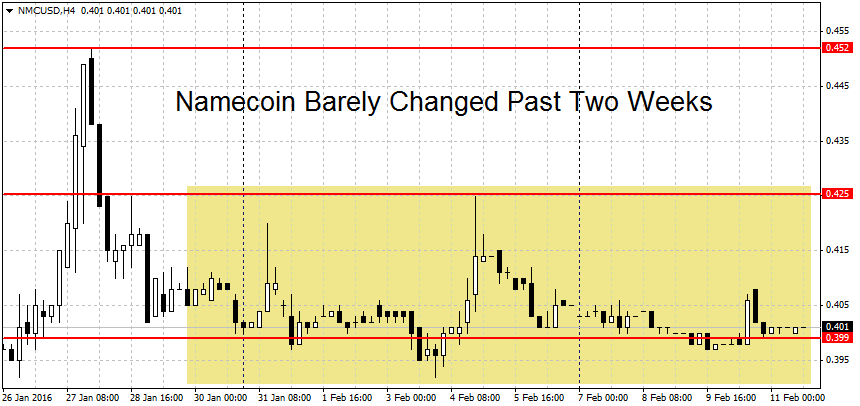
We’ve had some ups and downs but ultimately the bulls and the bears settled for $0.40 as the fair price for one Namecoin, at least for now. But ranges like these don’t last. If and when volatility picks up, we’re bound to get some movement so let’s get prepared.
A decisive breakout above the $0.452 swing high could start a new NMC uptrend. The next resistance after this is at $0.48 dollars, followed by the half-parity level at $0.50 dollars. Further out last November’s spike high at $0.54 is another potential resistance level.
On the other end, the bears will need to break the $0.357 swing low to start a new downtrend. Below here the first line of notable support is at the double bottom near $0.332 dollars. This is followed by August 2015 low at $0.306 and of course, the round $0.30 level. A clean move below here could lead to more losses toward the April 2015 lows at $0.274 dollars per coin.
FXOpen offers the world's most popular cryptocurrency CFDs*, including Bitcoin and Ethereum. Floating spreads, 1:2 leverage — at your service (additional fees may apply). Open your trading account now or learn more about crypto CFD trading with FXOpen.
*Important: At FXOpen UK, Cryptocurrency trading via CFDs is only available to our Professional clients. They are not available for trading by Retail clients. To find out more information about how this may affect you, please get in touch with our team.
This article represents the opinion of the Companies operating under the FXOpen brand only. It is not to be construed as an offer, solicitation, or recommendation with respect to products and services provided by the Companies operating under the FXOpen brand, nor is it to be considered financial advice.
Stay ahead of the market!
Subscribe now to our mailing list and receive the latest market news and insights delivered directly to your inbox.


Latest articles

US Dollar Strengthens Amid Equity Market Weakness and Hawkish Fed Rhetoric
The US dollar continues to hold firm near multi-year highs as sentiment across equity markets deteriorates and investors increasingly expect the Federal Reserve to maintain a restrictive monetary policy stance for longer. The US economy remains resilient, while inflation risks

Bitcoin: Corrective Channel Broken as Traders Turn More Active
Bitcoin has come under the influence of several factors simultaneously. The wave of selling at the beginning of June was linked to Strategy's first disclosed Bitcoin sale in several years, a prolonged series of outflows from spot ETFs, and a

DAX 40: consolidation amid technology sell-off
A wave of selling in the technology sector that emerged earlier this week has weighed on European equities. The trigger was investor concern over the profitability of large-scale debt-funded investments by major US tech companies in AI infrastructure. The Nasdaq