


Altcoins Surge in Major Rally
FXOpen
It’s been a great week for altcoins as almost all of them gained ground. Some like Peercoin and Namecoin gained substantially. Peercoin doubled since our last update while Namecoin more than tripled in value. We are clearly in a major rally (or bubble) depending on how you look at things.
Peercoin Prices Double
Peercoin continued the uptrend that started back in February. We are currently quoted at $0.695, over 100% above the $0.322 price noted two weeks ago.
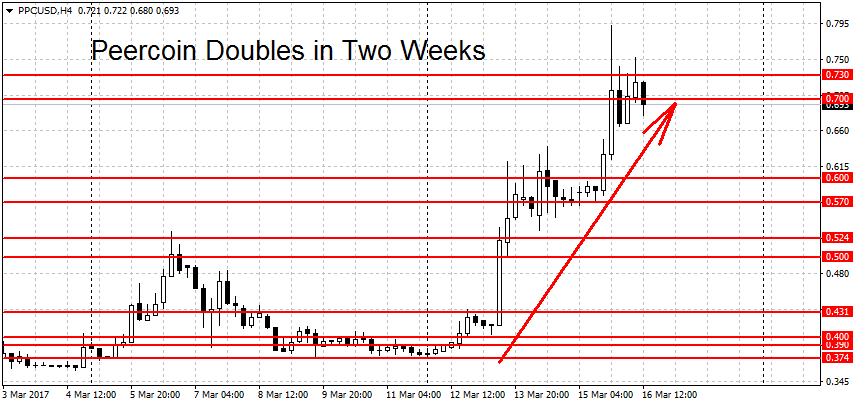
The gains up to here have been large but long entries at these levels will be difficult. Volatility has surged from around 1 cent per day at the start of the rally to over 7 cents right now. This means that finding a trade with a good risk to reward will also be difficult because the stop used will have to be relatively big.
For those already long, a move below $0.374 swing low could end the uptrend. Above here support can be found at the previous resistance levels (now turned support) at $0.337, $0.35 and the $0.388 swing high. Higher still there’s a few more potential support levels at $0.40, $0.50 and $0.524 dollars per coin.
Both the daily and the weekly chart for PPC/USD are bullish but the monthly has yet to switch upward from neutral mode.
Namecoin Triples in Value
Namecoin prices have more than tripled in value since our last update. This week alone NMC/USD doubled in price. The chart below shows this surge clearly.
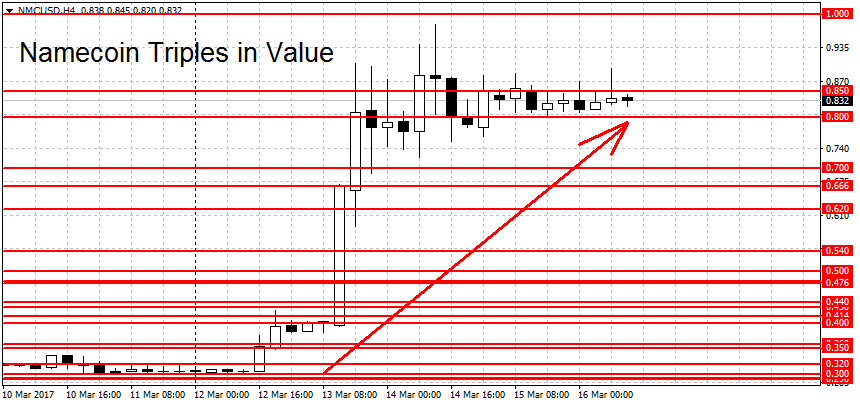
With the break above the $0.284 dollars swing high on March 2nd Namecoin was back in an uptrend. Almost two weeks later this trend is still in place.To end it, the bears will have to push NMC back below the 29 cents swing low. Above here we find potential support at the former $0.292 swing high, the 30 cents round figure and the September resistance (now turned support) at $0.32 dollars.
At over 80 cents per coin it’s hard to find good resistance levels because Namecoin hasn’t traded this high in almost two years. The $1 parity level is an obvious choice, as is the two year high at $1.30 dollars. What we said above about Peercoin applies here as well. Finding good R/R entries at these elevated levels will be difficult, so proceed with caution.
The longer-term charts for NMC/USD are mixed. The weekly is now in a bullish trend but the monthly remains undecided.
FXOpen offers the world's most popular cryptocurrency CFDs*, including Bitcoin and Ethereum. Floating spreads, 1:2 leverage — at your service (additional fees may apply). Open your trading account now or learn more about crypto CFD trading with FXOpen.
*Important: At FXOpen UK, Cryptocurrency trading via CFDs is only available to our Professional clients. They are not available for trading by Retail clients. To find out more information about how this may affect you, please get in touch with our team.
This article represents the opinion of the Companies operating under the FXOpen brand only. It is not to be construed as an offer, solicitation, or recommendation with respect to products and services provided by the Companies operating under the FXOpen brand, nor is it to be considered financial advice.
Stay ahead of the market!
Subscribe now to our mailing list and receive the latest market news and insights delivered directly to your inbox.


Latest articles

Weekly Market Insights with Gary Thomson: The Week of Central Banks and Earnings
In this video, we’ll explore the key economic events and market trends, shaping the financial landscape. Get ready for insights into financial markets to help you navigate the week ahead. Let’s dive in!
In this episode of Market

Intel at a Crossroads: Earnings Beat Meets Technical Resistance
Intel has just delivered its strongest quarter in over fifteen years, and the market reaction says it all. Q2 2026 revenue surged 25% year-over-year to $16.1 billion, crushing the consensus estimate of $14.42 billion, while adjusted EPS of

Tesla: Complex Range Structure Breaks Down Following Quarterly Earnings
Tesla released its Q2 2026 results after the market closed on 22 July. Revenue increased 26% year-on-year to $28.24 billion, while vehicle deliveries reached a record 480,126 units. However, operating margin fell sharply to 1.4%, down from