


Asian Session and Breakouts Detection
FXOpen
Forex could be compared to a chess game.
You are playing against the market. Who wants to be the winner? I believe that not a single trader is interested in returning money to the market. Allow yourself a bit of patience and wait for the price volatility to take the first move. It is recommended not to act in panic. Just wait for the first movement. So, you will be able to understand a new pattern or the general tendency.
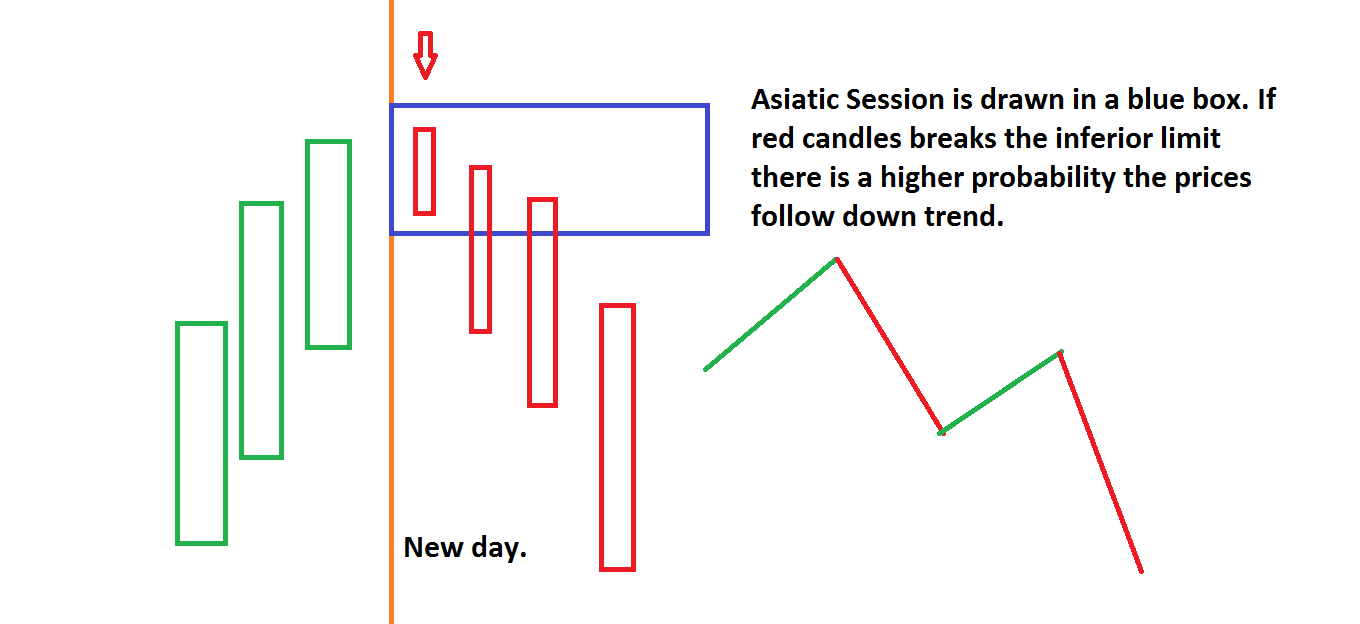
The Asian sessions are very interesting to watch to detect breakouts for the next day. Obviously, the fundamental news contributes to a new configuration of a currency pair. Check the following idea: draw a daily blue box that represents the opening of the Asian market and draw a lower limit and an upper limit to help put the lowest and highest prices of the late 8 consecutive hours. If there is a down disruption, the prices are decreasing. If there is a higher breakout, the prices are rising, and there is a high probability that the prices will remain in the same trend.
It can be seen in the picture below.
Let's examine some interesting cases that support our way of thinking.
Case 1: AUDUSD

Watching the Australian dollar dynamics, we can see that on the 20th of November (Wednesday) the price reached the highest peak of the week. In the coming days the price fell. Why? It happened due to the fact that AUDUSD had been overbought and it was time to sell it. The U.S. currency was strongly pushing aussie down.
On Wednesday, aussie had reached a demand level when the Asian market was opened. The lower limit of the box was broken and we can see that a white arrow is pointing strongly down their new trend. The chart gives us a clear idea that investors are bearish.
On Thursday, we draw a blue box with our limits (upper and lower). Again, prices continued to decline, which is a general consequence of the bearish sentiment. The last three days were followed by a depreciation of the AUD against USD.
At the opening of the markets on Monday, there is a probability that a new trend will occur. Pay attention to the gaps.
Case 2:

The second chart shows that the Australian dollar was oversold on Friday. So, draw a blue box to represent the Asian session. Note that there is a supply level demonstrating that the bullish trend is coming. An upper breakout was detected hours later.
A positive breakout is enough to show us that the market sentiment is bullish.
Case 3:
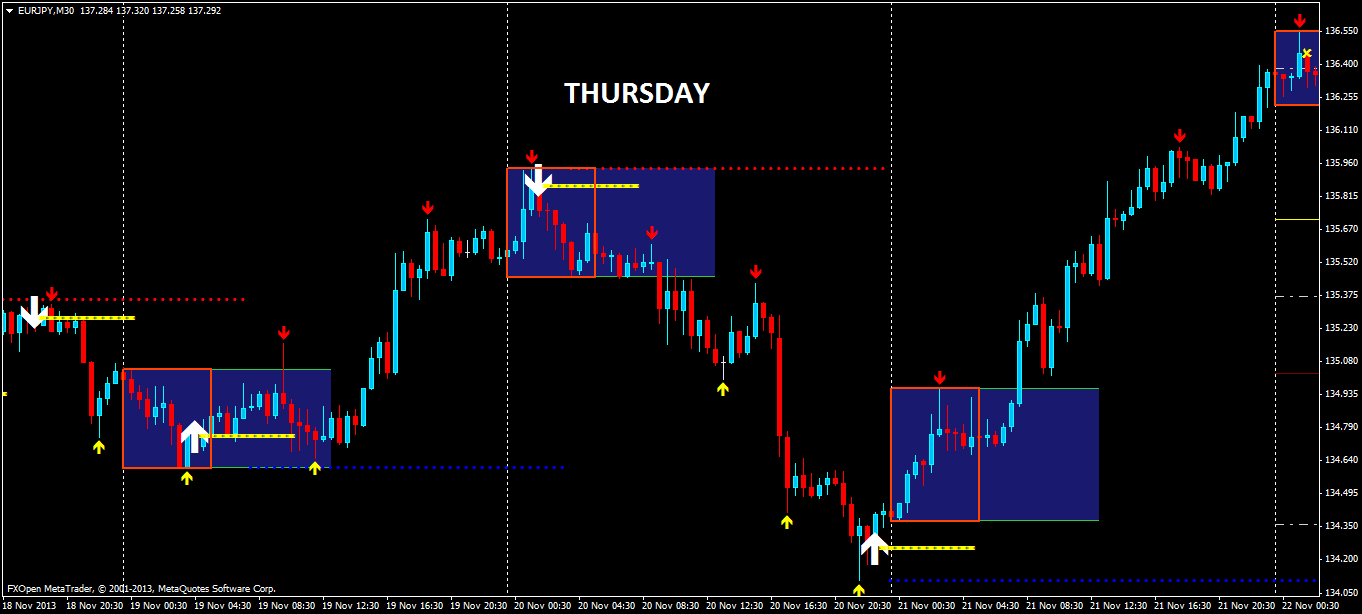
On November 20th, Thursday, EURJPY was hitting the demand level. The pair was overbought. The red candle broke our blue box and the sell pressure was confirmed. Note that a down breakout was formed a few hours later.
The next day, on Friday, EURJPY was oversold. The Asian session prices followed a new movement (upper breakout).
According to the collection of experiences I can understand that breakouts occur constantly. The prices usually vary in the beginning of a new session.
The best way to detect a breakout is to draw a blue box with the maximum and minimum prices. If there is an oversold level at the beginning of the session, then try to go long. If there is only one overbought level at the beginning of the session, then go short. But if there are no signs don’t do anything. Just wait for the market to take the first move.
The article is written by Igor Titara and is participating in the Forex Article Contest. Good luck!
This article represents the opinion of the Companies operating under the FXOpen brand only. It is not to be construed as an offer, solicitation, or recommendation with respect to products and services provided by the Companies operating under the FXOpen brand, nor is it to be considered financial advice.
Stay ahead of the market!
Subscribe now to our mailing list and receive the latest market news and insights delivered directly to your inbox.

Latest articles

Apple: Earnings Day Above the Activity Zone
On 30 April, after the market close, Apple Inc. will release its financial results for the second quarter of fiscal 2026. The consensus forecast, based on estimates from 31 analysts, points to revenue of around $109.7 billion, with expected

USD/JPY and USD/CHF Near Key Levels: The Dollar Supported by the Fed
The US dollar continues to trend upwards following the Federal Reserve meeting, drawing support from the regulator’s moderately hawkish stance and comments by Jerome Powell. Markets interpret the Fed’s rhetoric as a signal that restrictive policy is likely

EUR/USD and GBP/USD consolidate ahead of the Fed decision
European currencies are showing subdued dynamics, entering a consolidation phase following their previous advance. Earlier, EUR/USD and GBP/USD broke out of their ranges and strengthened; however, the subsequent correction has led both pairs to retest the previously breached