Bitcoin, Altcoins Surge Higher
FXOpen
It’s been a good day for almost all crypto-currencies today, especially vs the U.S. Dollar. The gains were driven higher by a surge in the value of bitcoin. As usual, litecoin followed BTC higher and closed the day up by 13 percent.
Bitcoin Back in Range After Spike
Bitcoin prices surged from $6,859 to $8,069 dollars today, a gain of 17.64 percent. We are currently quoted a bit below the highs at $7,897 dollars per coin. But what’s even more astounding is that the spike happened during the span of forty minutes. No major news can be pinned to the sudden buying as of yet.
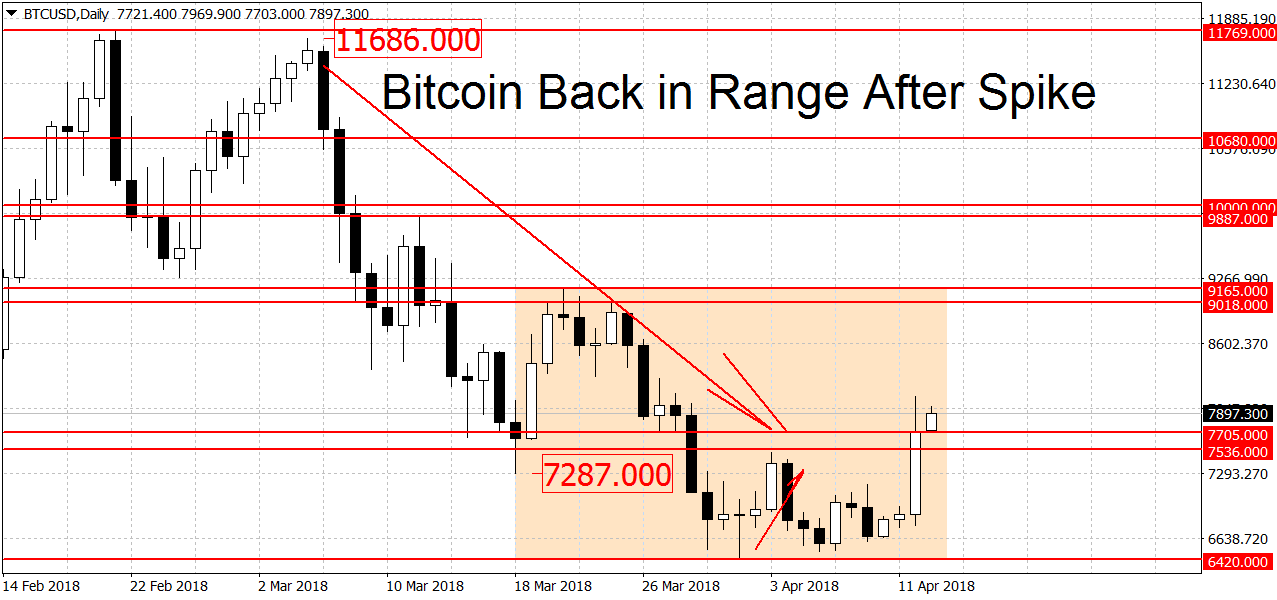
While the shocking gains today may tempt some to ‘FOMO‘ back in, bitcoin is now only in a range on the daily charts. A new bullish trend requires a breakout above the $9,165 swing high. Below we find weaker resistance levels at $9,018 and $9,000 dollars. Above there’s the $10,000 round figure, an important psychological barrier. This is followed by more resistance at $10,680, $11,000 and $11,769 dollars.
On the way down there’s a strong area of support around $6,420 to $6,600 dollars. A clearing of this support and a move below $6,420 would re-start the downtrend in BTC/USD. Further down we have this year’s low at $5,980 dollars. A breakdown below here may lead to more losses. Lower still the area around the $5,000 round figure is another notable support. On the weekly charts bitcoin is also range-bound but the monthlies are keeping the bullish bias.
Litecoin Higher but Still in a Downtrend
As is usually the case, litecoin followed BTC higher, with prices hitting a high of $131.03 earlier today. However unlike in BTC/USD here the gains weren’t enough to kill the downtrend. For that we need to see a break above the $136.31 dollars level. This is where the latest swing high and swing low meet. A breakout above would end the bear on the dailies but a new uptrend requires a break above the $169 dollars level as well.
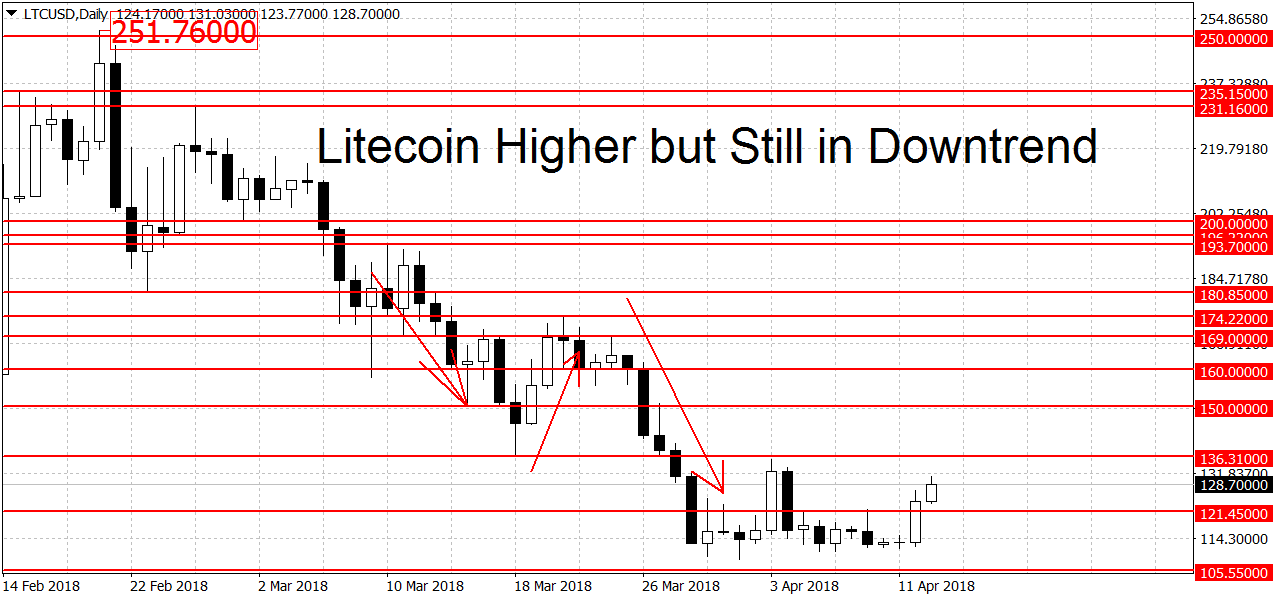
Higher up there’s more resistance at the $174.22 swing high, followed by $181 dollars and several levels around the $200 round figure. A decisive breakout above here could lead to more gains. On the lower end there’s support in the $105.55 – $108.44 area. A clearing of this area could lead to a break of the $100 round figure as well. This round level is also potential support for LTC/USD but it’s not as strong and it’s more on the psychological side compared to the double bottom around $105.55 dollars. On the longer-term weekly and monthly charts, LTC/USD is still looking bullish.
FXOpen offers the world's most popular cryptocurrency CFDs*, including Bitcoin and Ethereum. Floating spreads, 1:2 leverage — at your service (additional fees may apply). Open your trading account now or learn more about crypto CFD trading with FXOpen.
*Important: At FXOpen UK, Cryptocurrency trading via CFDs is only available to our Professional clients. They are not available for trading by Retail clients. To find out more information about how this may affect you, please get in touch with our team.
This article represents the opinion of the Companies operating under the FXOpen brand only. It is not to be construed as an offer, solicitation, or recommendation with respect to products and services provided by the Companies operating under the FXOpen brand, nor is it to be considered financial advice.
Stay ahead of the market!
Subscribe now to our mailing list and receive the latest market news and insights delivered directly to your inbox.


Latest articles


Australian Dollar Loses Momentum After May Peaks
Fundamental Background
The RBA’s third consecutive interest rate increase to 4.35% reflects the regulator’s concern over rising inflation: the conflict in the Middle East is increasing energy costs and putting upward pressure on prices. Annual consumer inflation