


Bitcoin and Litecoin Continue to Push on Resistance Levels
FXOpen
Both Bitcoin and Litecoin are still trading right below their respective resistance levels. For LTC/USD, this level stands at $1.50 while for BTC it’s at $250 dollars per coin. Since our update last week, both cryptos have made unsuccessful attempts to rally higher.
Bitcoin Pushing on $250
Bitcoin continues to push on the $250 resistance level. On Saturday we reached a new 30-day high at $247.07 but soon after the sellers pushed the virtual currency back below $240. We are currently trading at $242 flat on FXOpen.
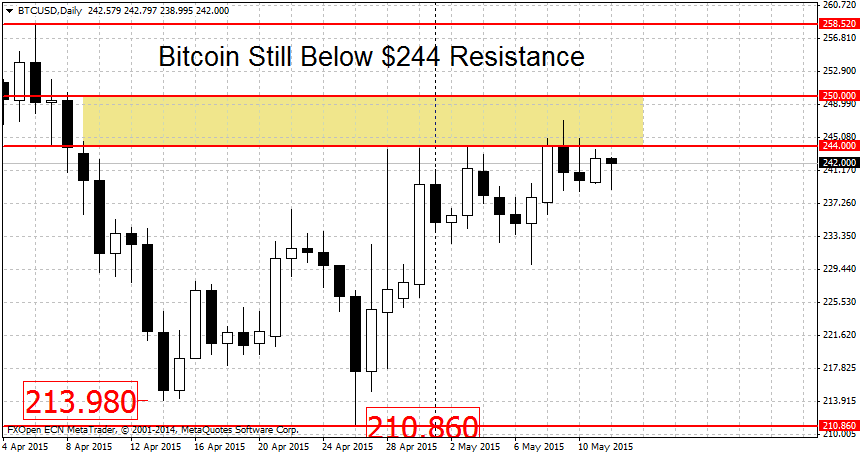
As can be seen on the chart above, we have been pushing on the $244-$250 resistance since the start of May, for a full 12 days now. This tilts the odds that the eventual breakout will be to the upside. The successive higher highs and higher lows also point to a bullish scenario. Still, the conservative approach calls to wait for an actual clearing of $250. Notable resistance figures above it include $258 (weak level) and $270. The major resistance level on the higher end will be the round psychological $300 number. This was also the stopping point for two previous BTC rallies. A breakout above $300 should intensify the gains.
On the downside, the first weak support can be found at $230. This is followed by the double bottom near $210 dollars per coin (seen on the chart above). As we’ve mentioned before, the entire area from $200 to $210 should be treated as one large support. We will need to see a break below $200 to spark a new downtrend in prices.
Litecoin Pushing on $1.50
Right as Bitcoin is pushing on $250, LTC is doing the same on $1.50. On Thursday we rallied to a high of $1.4796 but this was met with heavy selling. A renewed push on Saturday reached a new multi-day high of $1.4810. But yet again, the highs were met with aggressive sellers that brought LTC/USD down to $1.4223. We are currently quoted not far from these lows at $1.4340.

Litecoin is in a similar situation as big brother. While the price action indicates an eventual break higher, caution is advised. Waiting for a breakout above $1.50 should provide the needed confirmation. Important resistance levels above here include $1.60 and $1.70. Higher up we find the the March 23rd swing high near $1.80 ($1.7961). On the lower end, the double bottom near $1.30 per coin should provide some support to falling prices. A clearing of this level may resume the downtrend and lead to more LTC losses.
FXOpen offers the world's most popular cryptocurrency CFDs*, including Bitcoin and Ethereum. Floating spreads, 1:2 leverage — at your service (additional fees may apply). Open your trading account now or learn more about crypto CFD trading with FXOpen.
*Important: At FXOpen UK, Cryptocurrency trading via CFDs is only available to our Professional clients. They are not available for trading by Retail clients. To find out more information about how this may affect you, please get in touch with our team.
This article represents the opinion of the Companies operating under the FXOpen brand only. It is not to be construed as an offer, solicitation, or recommendation with respect to products and services provided by the Companies operating under the FXOpen brand, nor is it to be considered financial advice.
Stay ahead of the market!
Subscribe now to our mailing list and receive the latest market news and insights delivered directly to your inbox.


Latest articles

US Dollar Index: A Defining Week for the King of the Markets
The dollar heads into a pivotal week trading near 101.80, just off a 15-month high, with the Fed's July 29 meeting standing as the clear focal point. Markets currently price roughly a 65% chance of a hold, though renewed

NZD/USD: Inflation Surge Meets Strong US Dollar Pressure
On 21 July, Stats NZ reported an acceleration in inflation: the Consumer Price Index rose 1.5% in the second quarter, while the annual inflation rate climbed to 4.1%, its highest level in more than two years and slightly

Weekly Market Insights with Gary Thomson: The Week of Central Banks and Earnings
In this video, we’ll explore the key economic events and market trends, shaping the financial landscape. Get ready for insights into financial markets to help you navigate the week ahead. Let’s dive in!
In this episode of Market