


FXOpen
Bitcoin fell to new lows last week as the downtrend continues. Prices dropped to $6,420 dollars per coin before a temporary bottom was found. On LTC/USD a low of $108.44 was hit before prices recovered somewhat.
Bitcoin Bounces From Lows
Bitcoin is quoted at $7,378 dollars right now, a gain of 15 percent from the lows. However, this bounce is still very much in the realm of ‘dead cat’, as counting from the start of March bitcoin is down by 29 percent.
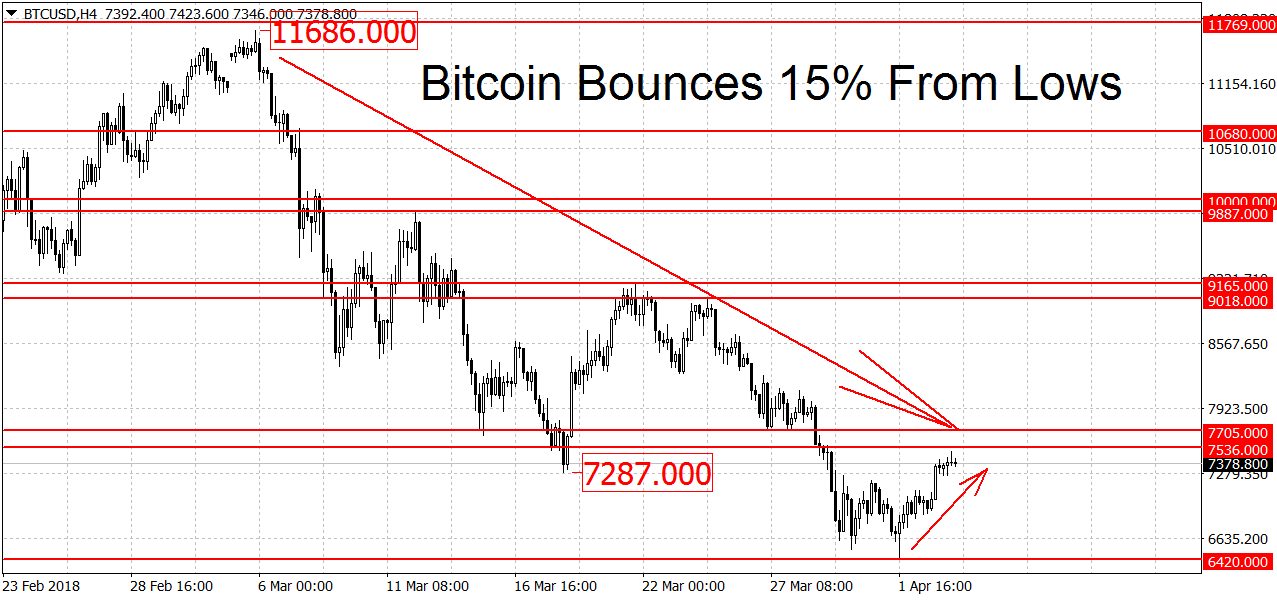
To end the current downtrend on the daily charts BTC/USD needs to break the $9,018 swing high. A new uptrend may commence if we decisively break the $9,165 high. Higher up there’s more resistance at the $9,887 swing high followed by the $10,000 round figure. A breakout above here may accelerate the gains. But with BTC at $7,378 we are still far from that scenario.
Below current prices, there’s support at the latest swing low of $6,420 dollars. This is followed by this year’s low at $5,980 dollars. A breakdown below this level may lead to more losses. Further down the $5,000 round figure is another notable support. On the weekly charts, BTC/USD is still range-bound but the monthlies are keeping the bullish bias.
Litecoin Back at $130 Dollars
Litecoin is back above the $130 dollars level after a strong bounce. On Sunday a low of $108.44 was hit but from here prices rallied by almost 25 percent to a high of $135.52 dollars. We are currently trading slightly below this high at $131.30 dollars.
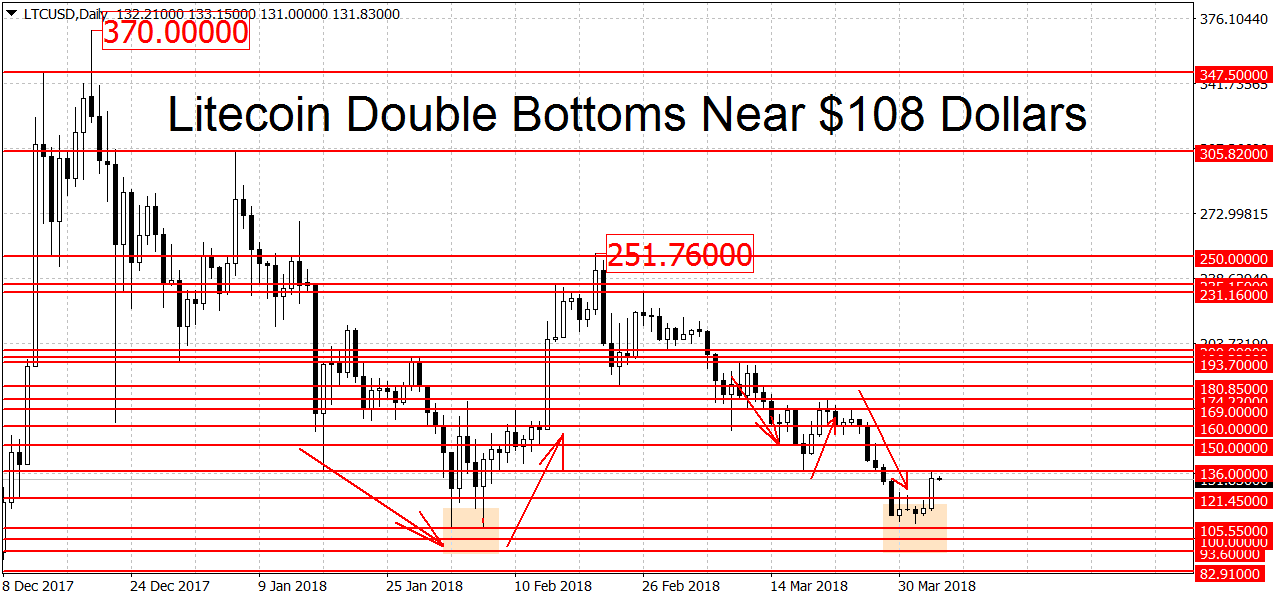
Below there’s strong support in the $105.55 to $108.44 double bottom area. While not a perfect double bottom, on the daily charts this is ‘good enough’. Three percent difference doesn’t mean much here. However, it’s not clear if this bounce will turn into a real trend reversal as we only had one day of strong gains for LTC. For now, Litecoin remains in a downtrend. To end it the bulls need to push us above $169 dollars per coin. A new rally requires a break above the $174.22 swing high as well.
A breakdown below the $105.55 swing low could lead to more losses. The downtrend could accelerate if the move continues below the $100 round figure. On the longer-term weekly and monthly charts, LTC/USD is still looking bullish.
Trade Bitcoin, Litecoin or other cryptos in the form of CFDs with FXOpen broker.
FXOpen offers the world's most popular cryptocurrency CFDs*, including Bitcoin and Ethereum. Floating spreads, 1:2 leverage — at your service. Open your trading account now or learn more about crypto CFD trading with FXOpen.
*At FXOpen UK and FXOpen AU, Cryptocurrency CFDs are only available for trading by those clients categorised as Professional clients under FCA Rules and Professional clients under ASIC Rules respectively. They are not available for trading by Retail clients.
This article represents the opinion of the Companies operating under the FXOpen brand only. It is not to be construed as an offer, solicitation, or recommendation with respect to products and services provided by the Companies operating under the FXOpen brand, nor is it to be considered financial advice.
Stay ahead of the market!
Subscribe now to our mailing list and receive the latest market news and insights delivered directly to your inbox.

Latest articles

Weekly Market Wrap With Gary Thomson: Nasdaq, EUR/USD, USD/CHF, Brent Crude Oil, Googl Shares
Get the latest scoop on the week's hottest headlines, all in one convenient video. Join Gary Thomson, the COO of FXOpen UK, as he breaks down the most significant news reports and shares his expert insights.
- Nasdaq Composite: Worst Session

Analysis of AUD/USD: Exchange Rate Falls to Early May Low
As indicated by the 4-hour AUD/USD chart today:
→ the rate fell below 0.652, a level last seen on May 2;
→ the RSI indicator dropped below 15, a level last seen during the panic over the spread of COVID-19

Analysis of AMZN Stock: Price at 1.5-Month Low
As shown in the AMZN chart, the stock price dropped below:
→ the psychological level of $180;
→ the mid-June interim low.
The last time AMZN traded below $180 was in early June.
Thus, AMZN has faced sell-offs, similar to other tech