


Bitcoin Breakout Hits Stumbling Block
FXOpen
Bitcoin broke out above the top of its range at $340 dollars last week and proceeded to rally almost $40 dollars to a high of $379.80. Here the gains topped however as BTC hit a previous congestion area. Litecoin again followed bitcoin, first higher, then lower. But let’s start with big brother first.
Bitcoin Breakout Hits $380 Dollars
The bitcoin breakout above $340 hit a high of $379.80 before falling back. The correction that followed lead to a low of $353 flat. We are currently quoted at $360.73, close to the lows for the day.
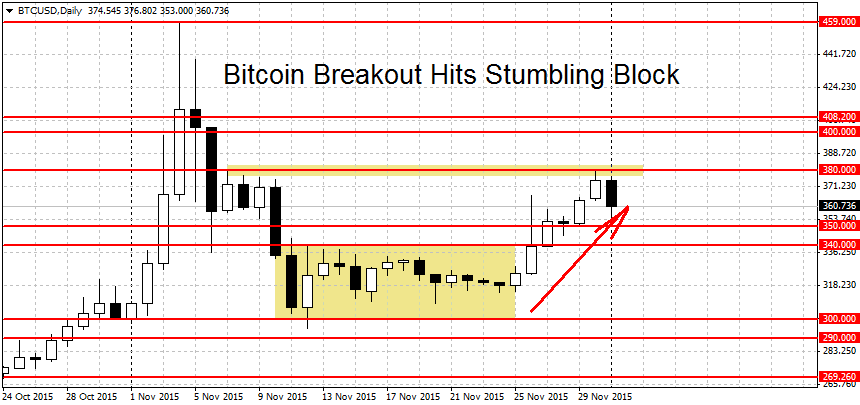
While BTC/USD made significant headway this week, we haven’t breached the important breakout levels thus we are not in rally mode yet. The threshold for that currently stands at $380 dollars per coin. A decisive breakout above this previous congestion will start a new BTC rally. Higher up more resistance can be found at the $400 round figure, followed by another round figure at $450 and this year’s high on FxOpen at $459.
On the other side, the first major support level is the top of the range we just broke out from, around $340-$350 dollars. Resistance becomes support and this previous lid on prices may now turn to support them on the way down. Lower still the low of the range is set at the round $300 figure. This is another potential support level. But to start a new downtrend, the bears will need to push BTC below $290 dollars per coin.
Litecoin Follows Bitcoin
In the past seven days, alternative cryptocurrency Litecoin rallied and fell on bitcoin’s orders. First we saw LTC/USD breakout above the high of its range at $3.26, followed by a 14 percent rally to a high of $3.74. From here prices retraced to a low of $3.35. We are currently trading at $3.44 on FxOpen.
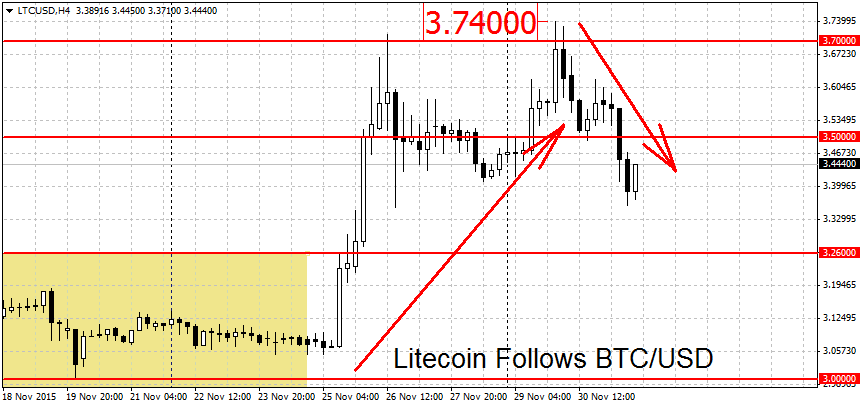
What’s next for Litecoin? A decisive breakout beyond the $3.74 high (not just a brief spike above it) may start a new LTC rally. Notable resistance levels above here include the $4 and $4.50 round figures, followed by the November high for Litecoin at $4.85 dollars.
On the lower end things haven’t changed since last week. The figure to watch is still the $2.88 low. A break of this level would start a new downtrend. Important support levels below include $2.70 and $2.50 dollars per coin, followed by the January swing high at $2.40 dollars. Further down, the support area from $2 to $2.05 is another important level.
FXOpen offers the world's most popular cryptocurrency CFDs*, including Bitcoin and Ethereum. Floating spreads, 1:2 leverage — at your service (additional fees may apply). Open your trading account now or learn more about crypto CFD trading with FXOpen.
*Important: At FXOpen UK, Cryptocurrency trading via CFDs is only available to our Professional clients. They are not available for trading by Retail clients. To find out more information about how this may affect you, please get in touch with our team.
This article represents the opinion of the Companies operating under the FXOpen brand only. It is not to be construed as an offer, solicitation, or recommendation with respect to products and services provided by the Companies operating under the FXOpen brand, nor is it to be considered financial advice.
Stay ahead of the market!
Subscribe now to our mailing list and receive the latest market news and insights delivered directly to your inbox.


Latest articles

US Dollar Strengthens Amid Equity Market Weakness and Hawkish Fed Rhetoric
The US dollar continues to hold firm near multi-year highs as sentiment across equity markets deteriorates and investors increasingly expect the Federal Reserve to maintain a restrictive monetary policy stance for longer. The US economy remains resilient, while inflation risks

Bitcoin: Corrective Channel Broken as Traders Turn More Active
Bitcoin has come under the influence of several factors simultaneously. The wave of selling at the beginning of June was linked to Strategy's first disclosed Bitcoin sale in several years, a prolonged series of outflows from spot ETFs, and a

DAX 40: consolidation amid technology sell-off
A wave of selling in the technology sector that emerged earlier this week has weighed on European equities. The trigger was investor concern over the profitability of large-scale debt-funded investments by major US tech companies in AI infrastructure. The Nasdaq