


Bitcoin Breaks Out, Litecoin Fails at Resistance
FXOpen
The two major crypto-currencies Bitcoin and Litecoin clocked some nice gains this week. Bitcoin is up by $26 dollars or 4.5 percent compared to last Tuesday. Meanwhile its little brother Litecoin is up by 15 cents or just under 4 percent.
Bitcoin Breaks Out
Bitcoin surged on Sunday, breaking past the $600 round figure. The reason for the rise is yet unclear although ex-post facto some tried to tie the move to the G20 meeting held during the weekend. Another option is Bitfinex-related speculative buying. Volume more then doubled on this exchange during the short rally. No news have been announced as of yet by the troubled exchange.
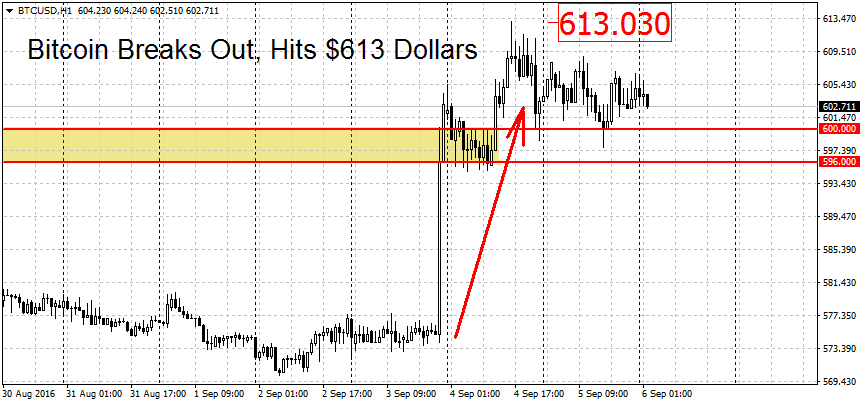
Regardless of the reason, we’re now in a tentative short-term uptrend. To end it, the bears will have to push prices below the $567 swing low. Further down we have a strong level of support at $550 dollars followed by the round $500 dollars figure.
On the upside, the first weak resistance is Sundays high at $613 dollars per coin. A break above here would confirm that the Sunday surge wasn’t just a one-day wonder. A much stronger resistance level can be found at the $650 mark. This is followed by more resistance levels at $670, $687 and $700 dollars per coin. For bitcoin now all three trends (short, medium and long-term) are bullish.
Litecoin Fails at $4 Dollars Again
Alternative cryptocurrency Litecoin failed to break above the $4 dollars mark a second time. Attempt number two took place right as big brother bitcoin surged on Sunday. Litecoin rose to a high of $4.018 but here the move stopped and we got a retracement to $3.91 dollars. We’re now quoted at $3.93 dollars per coin.
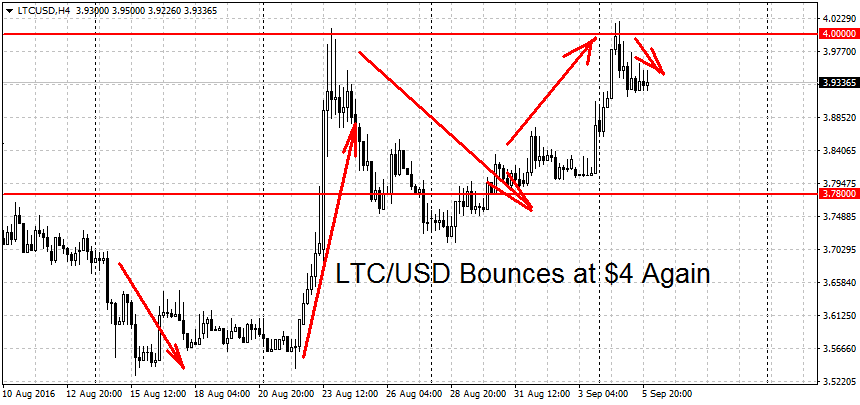
As we said last week, we’re looking for a decisive break of the $4 dollars level. The brief and shallow pierce that happened on Sunday doesn’t qualify, thus LTC/USD remains neutral. A move above $4 dollars would start a new short-term uptrend. Resistance levels above here can be found at the $4.07 swing high, followed by $4.15. Higher up we find a resistance area from $4.43 to $4.52 per coin. A clearing of this area could intensify the gains for LTC.
On the lower end the bears need a break of the $3.50 level to restart the downtrend. Below here we have support at the $3.22 lows hit in the aftermath of the Bitfinex hack. More levels can be found below at the $3 round figure, followed by this year’s low for Litecoin at $2.89 dollars. Lower still we have the twelve-month low near $2.50 dollars per coin. A breakdown below here could lead to more losses.
FXOpen offers the world's most popular cryptocurrency CFDs*, including Bitcoin and Ethereum. Floating spreads, 1:2 leverage — at your service (additional fees may apply). Open your trading account now or learn more about crypto CFD trading with FXOpen.
*Important: At FXOpen UK, Cryptocurrency trading via CFDs is only available to our Professional clients. They are not available for trading by Retail clients. To find out more information about how this may affect you, please get in touch with our team.
This article represents the opinion of the Companies operating under the FXOpen brand only. It is not to be construed as an offer, solicitation, or recommendation with respect to products and services provided by the Companies operating under the FXOpen brand, nor is it to be considered financial advice.
Stay ahead of the market!
Subscribe now to our mailing list and receive the latest market news and insights delivered directly to your inbox.


Latest articles

Weekly Market Insights with Gary Thomson: The Week of Central Banks and Earnings
In this video, we’ll explore the key economic events and market trends, shaping the financial landscape. Get ready for insights into financial markets to help you navigate the week ahead. Let’s dive in!
In this episode of Market

Intel at a Crossroads: Earnings Beat Meets Technical Resistance
Intel has just delivered its strongest quarter in over fifteen years, and the market reaction says it all. Q2 2026 revenue surged 25% year-over-year to $16.1 billion, crushing the consensus estimate of $14.42 billion, while adjusted EPS of

Tesla: Complex Range Structure Breaks Down Following Quarterly Earnings
Tesla released its Q2 2026 results after the market closed on 22 July. Revenue increased 26% year-on-year to $28.24 billion, while vehicle deliveries reached a record 480,126 units. However, operating margin fell sharply to 1.4%, down from