Bitcoin Consolidates Below $250 Dollars
FXOpen
Both Bitcoin and Litecoin entered a consolidation period last week. Big brother bitcoin is trading around the $230 dollars mark while litecoin’s move higher got rejected at $3 dollars.
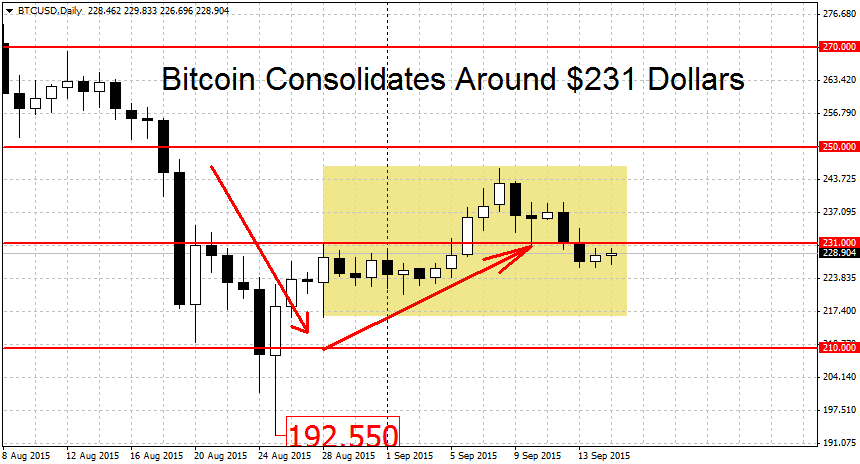
Bitcoin Consolidates Around $231 Dollars
Everyone’s favorite crypto-currency has entered a consolidation period. During the past seven days, BTC/USD moved in a range between a low of $226.05 and a high at $245.80. We are currently quoted at $228.90.
Consolidation was the likely outcome, as suggested in our article last week when we said that: ”caution is advised because we just ended the previous downtrend. Markets usually don’t switch from downtrend to uptrend right away. This doesn’t mean that a rally wont happen but it’s the less likely scenario compared to say, more consolidation below $250.”
What’s next for bitcoin? A break below the $216 swing low may have some follow-through. But the problem is that close-by we have a more important level in the former double bottom at $210. We may need to see decisive break of this level to restart the downtrend. Further down, the August 25th swing low at $192 dollars is another figure to keep an eye on. The important levels to the downside end with this year’s low at $162 dollars per coin.
On the upper side, the first notable resistance is at $250 dollars. To begin a new rally, the bulls will need to push prices above this previous support now turned resistance. Higher up we find more resistance at the $270 dollars mark.
Litecoin Bounces at $3 Dollars
Alternative cryptocurrency Litecoin bounced off the $3 – $3.18 resistance area. As noted in our article last week, LTC/USD was trading right between these levels, fighting with the important resistance at $3.18 dollars per coin. As can be seen on the chart below, the bears ultimately won and they took down LTC. On Sunday we hit a new multi-day low of $2.73. We have since bounced back somewhat with litecoin currently quoted at $2.77.
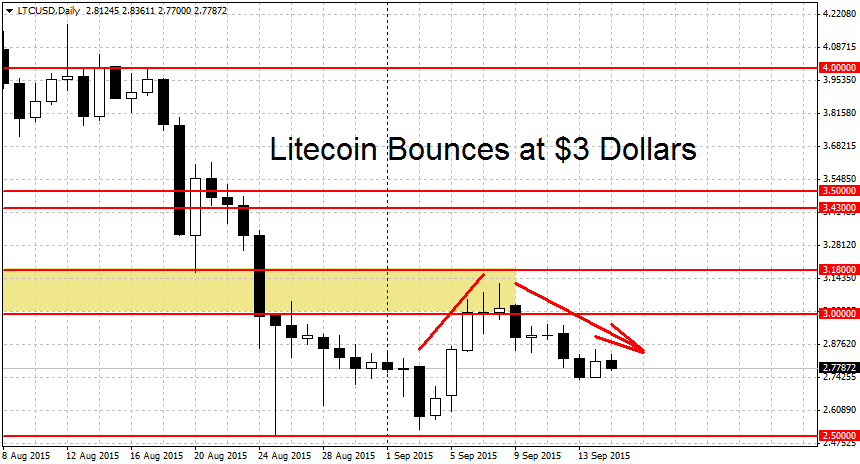
Litecoin is in a similar situation to bitcoin. Both cryptos are in consolidation and waiting for their next catalyst for big moves. For LTC/USD the two key levels are $3.18 on the top end and $2.40 on the bottom. A clean breakout above $3.18 would start a new LTC uptrend. The reverse is true for a break below the $2.40 dollars mark, this would restart the downtrend and open the door for more losses toward $2.05.
Other levels in between are the swing low at $2.50 dollars and the round $3 dollars figure. But with the two key figures close-by, it’s likely that these levels will get overshadowed by $2.40 and $3.18.
FXOpen offers the world's most popular cryptocurrency CFDs*, including Bitcoin and Ethereum. Floating spreads, 1:2 leverage — at your service (additional fees may apply). Open your trading account now or learn more about crypto CFD trading with FXOpen.
*Important: At FXOpen UK, Cryptocurrency trading via CFDs is only available to our Professional clients. They are not available for trading by Retail clients. To find out more information about how this may affect you, please get in touch with our team.
This article represents the opinion of the Companies operating under the FXOpen brand only. It is not to be construed as an offer, solicitation, or recommendation with respect to products and services provided by the Companies operating under the FXOpen brand, nor is it to be considered financial advice.
Stay ahead of the market!
Subscribe now to our mailing list and receive the latest market news and insights delivered directly to your inbox.


Latest articles

Market Analysis: GBP/USD Turns Bullish Again While EUR/GBP Drops More
GBP/USD is showing positive signs above 1.3440 and 1.3460. EUR/GBP declined and is now consolidating losses below 0.8680.
Important Takeaways for GBP/USD and EUR/GBP Analysis Today
· The British Pound started a fresh increase
Netflix 2026: Reversal on the Deal, Pullback on Earnings
Fundamental Background
At the end of February, Netflix withdrew from the bid for Warner Bros. Discovery assets after WBD’s board deemed Paramount Skydance’s $31-per-share offer more attractive. Netflix chose not to raise its own bid of $27.75