


FXOpen
Bitcoin continues the range-bound trading this week. We’re quoted at $10,328 dollars right now, down from $11,211 last Tuesday. Litecoin is also trading lower but keeping its bullish bias.
Bitcoin Continues Range-bound Trading
The high but directionless volatility continues in BTC/USD. During the past seven days we traded as low as $9,270 and as high as $11,054 dollars. While bitcoin is down this week it hasn’t broken any important support levels yet.
A new downtrend requires a break below the $7,705 swing low. Above here we find support at the $10,000 round figure, followed by $9,280 swing low. Further down we have the previous resistance now turned support at $9,049, closely followed by the $9,000 round level.
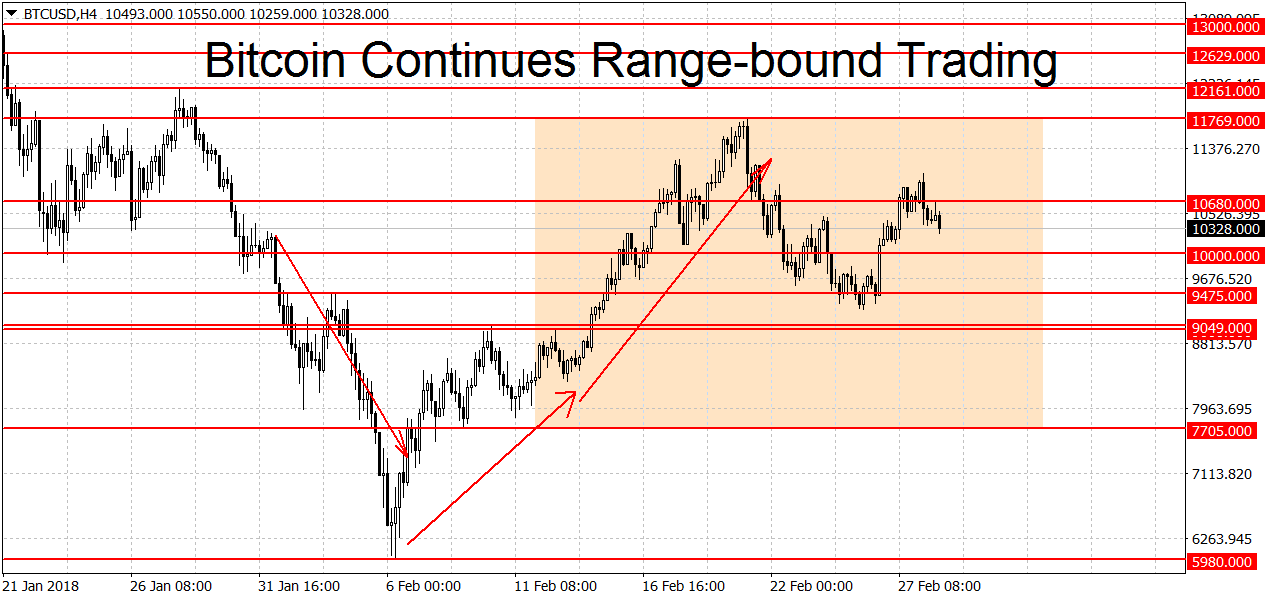
Higher up there’s resistance at yesterday’s high of $11,054 but a new uptrend needs a breakout above the $11,769 swing high as well. The swing high at $12,161 dollars is another notable resistance level. We have more levels higher up at $12,629, $12,982 and the $13,000 round figure. On the weekly charts BTC is range-bound as well but the monthly charts are still in an uptrend.
Litecoin Trading Lower
Litecoin is trading lower compared to last week, quoted at $201.81 dollars right now. This is a loss of just over 11 percent since our last update.
Despite the losses LTC/USD remains in rally mode. To end it the bears will have to push us below the $180.85 swing low. A break below $136 dollars is needed to trigger a new downtrend. In between these levels support can be found at the $150 and $160 round figures, followed by the $168.13 and $173.25 swing highs. Higher still there’s more support at the former resistance now turned support at $196.22 and at the $200 round figure.
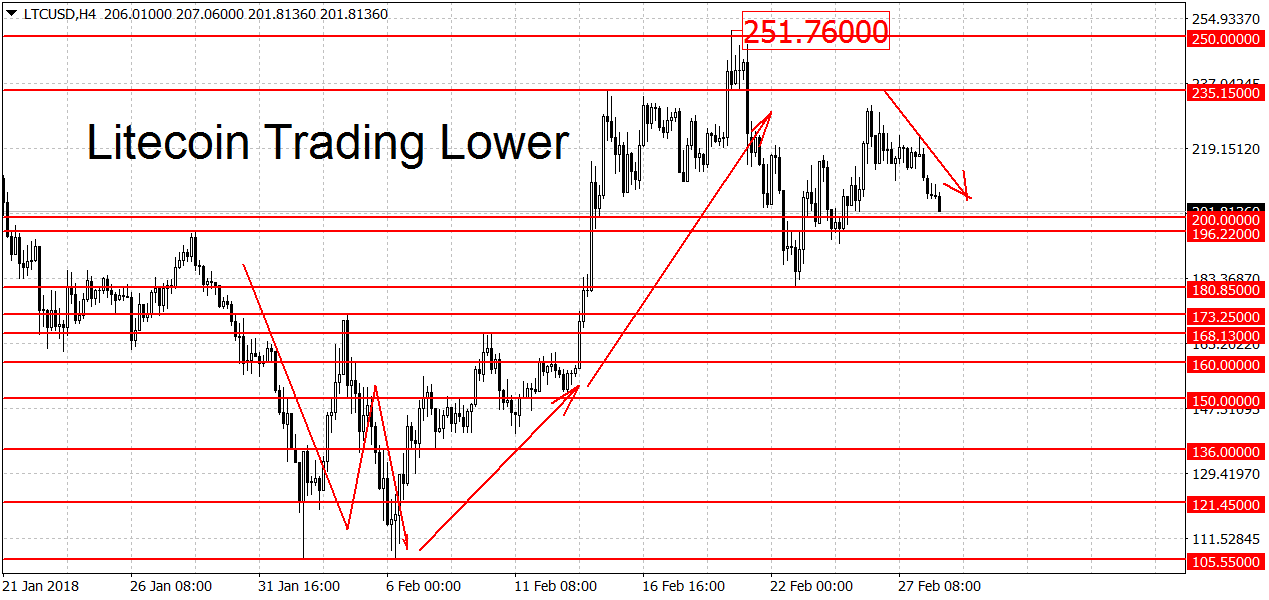
On the upside we find resistance at the last swing high of $231.16 (weak) followed by $235.15 dollars. Stronger resistance levels can be found at the $250 round figure followed by this month’s high at $251.76 dollars per coin. Higher still we have the $300 round figure and of course the all-time high at $370 dollars is another notable resistance level. On the longer-term weekly charts and monthly charts LTC is also looking bullish.
FXOpen offers the world's most popular cryptocurrency CFDs*, including Bitcoin and Ethereum. Floating spreads, 1:2 leverage — at your service. Open your trading account now or learn more about crypto CFD trading with FXOpen.
*At FXOpen UK and FXOpen AU, Cryptocurrency CFDs are only available for trading by those clients categorised as Professional clients under FCA Rules and Professional clients under ASIC Rules respectively. They are not available for trading by Retail clients.
This article represents the opinion of the Companies operating under the FXOpen brand only. It is not to be construed as an offer, solicitation, or recommendation with respect to products and services provided by the Companies operating under the FXOpen brand, nor is it to be considered financial advice.
Stay ahead of the market!
Subscribe now to our mailing list and receive the latest market news and insights delivered directly to your inbox.

Latest articles

Weekly Market Wrap With Gary Thomson: Nasdaq, EUR/USD, USD/CHF, Brent Crude Oil, Googl Shares
Get the latest scoop on the week's hottest headlines, all in one convenient video. Join Gary Thomson, the COO of FXOpen UK, as he breaks down the most significant news reports and shares his expert insights.
- Nasdaq Composite: Worst Session

Analysis of AUD/USD: Exchange Rate Falls to Early May Low
As indicated by the 4-hour AUD/USD chart today:
→ the rate fell below 0.652, a level last seen on May 2;
→ the RSI indicator dropped below 15, a level last seen during the panic over the spread of COVID-19

Analysis of AMZN Stock: Price at 1.5-Month Low
As shown in the AMZN chart, the stock price dropped below:
→ the psychological level of $180;
→ the mid-June interim low.
The last time AMZN traded below $180 was in early June.
Thus, AMZN has faced sell-offs, similar to other tech