


FXOpen
For the past two weeks both Bitcoin and Litecoin have been stuck in a relatively tight ranges. Compared to last Tuesday, BTC/USD is down by only 1 percent, from $415 to $410.74. Litecoin is down by a larger 3 percent, from $3.28 to $3.18 dollars per coin. But let’s start with big brother and we’ll get back to LTC later in the article.
Bitcoin Little Changed as Range Continues
Like we noted above, Bitcoin is barely changed since last Tuesday. The total range during the past seven days is only $13.47 dollars, or just above 3 percent. On the chart below this range in marked with a yellow rectangle. As you can probably deduce the size of this range, no major levels were broken since our last BTC update.
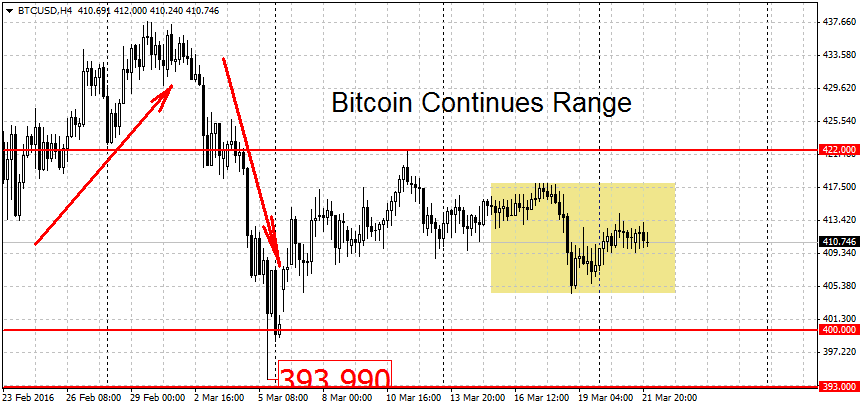
Consequently, the two key levels remain at $440 dollars on the upside and $393 dollars on the downside. A decisive break of either of these two price extremes should end the current deadlock. Above $440 we find a strong resistance level at $450 dollars level. This is followed by another resistance area around $460-$470 dollars. A clearing of this area may propel prices toward last year’s high at $500 dollars.
On the other end, below $393 we have some support at $374 and $350 dollars per coin. A clean move below $350 may extend the move toward the support area around $300-$310 dollars. This was the highest high for BTC/USD during most of last year until the November rally. Resistance turns to support so this former lid may now act as a floor to falling prices.
Litecoin Lower by 3 Percent
Alternative cryptocurrency Litecoin is trading lower by 3 percent. As we can see on the chart below, unlike BTC, Litecoin failed to recover from the selling pressure. At he low point, prices almost matched the previous swing low at $3.1250 ($3.1251) before rebounding higher. The past seven days are again marked with a yellow rectangle.
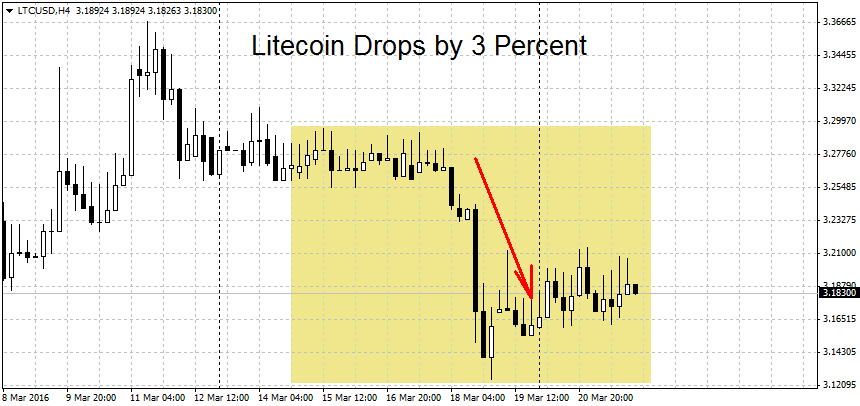
Our readers may remember that last week we noted the $3.12 dollars level as a potential game changer for LTC/USD. A decisive breakdown below here could start a new trend lower. Further down we have support at the round $3 level, followed by a strong area of support around $2.89/$2.90 dollars. A clearing of this area may lead to more losses toward $2.70 or even $2.50 dollars per coin.
On the upper end the hurdle to starting a new rally stands at the round $3.50 level. Above here we find more resistance at the $3.65 dollars swing high, followed by $3.82 dollars. This is followed by the two round figures at $4.00 and $4.50 dollars. Higher up there’s yet another former swing high at $4.85, the highest point for LTC/USD during bitcoin’s rally last November. Above here we find the round $5 dollars figure. The important levels on the upside end with last year’s high for LTC at $8.64 dollars per coin.
FXOpen offers the world's most popular cryptocurrency CFDs*, including Bitcoin and Ethereum. Floating spreads, 1:2 leverage — at your service. Open your trading account now or learn more about crypto CFD trading with FXOpen.
*At FXOpen UK and FXOpen AU, Cryptocurrency CFDs are only available for trading by those clients categorised as Professional clients under FCA Rules and Professional clients under ASIC Rules respectively. They are not available for trading by Retail clients.
This article represents the opinion of the Companies operating under the FXOpen brand only. It is not to be construed as an offer, solicitation, or recommendation with respect to products and services provided by the Companies operating under the FXOpen brand, nor is it to be considered financial advice.
Stay ahead of the market!
Subscribe now to our mailing list and receive the latest market news and insights delivered directly to your inbox.

Latest articles

Weekly Market Wrap With Gary Thomson: Nasdaq, EUR/USD, USD/CHF, Brent Crude Oil, Googl Shares
Get the latest scoop on the week's hottest headlines, all in one convenient video. Join Gary Thomson, the COO of FXOpen UK, as he breaks down the most significant news reports and shares his expert insights.
- Nasdaq Composite: Worst Session

Analysis of AUD/USD: Exchange Rate Falls to Early May Low
As indicated by the 4-hour AUD/USD chart today:
→ the rate fell below 0.652, a level last seen on May 2;
→ the RSI indicator dropped below 15, a level last seen during the panic over the spread of COVID-19

Analysis of AMZN Stock: Price at 1.5-Month Low
As shown in the AMZN chart, the stock price dropped below:
→ the psychological level of $180;
→ the mid-June interim low.
The last time AMZN traded below $180 was in early June.
Thus, AMZN has faced sell-offs, similar to other tech