


Bitcoin Enters Downtrend
FXOpen

After several weeks of an indecisive price action, Bitcoin has finally entered a downtrend this week. The bigger brother joins Litecoin which has been in a down-spell for over 1 month now.
Bitcoin Enters Downtrend
Bitcoin prices are now in a downtrend. Notice how on the daily chart below BTC finally broke out from that long triangle pattern. We are currently quoted at $596 per coin.
Support below here can be found at $589 followed by $540-$550 on FXOpen. Further down the round figure at $500 is another notable support. The breakout point for the latest major rally at $462 per coin is a major level to watch as well. More levels can be seen in the chart below.
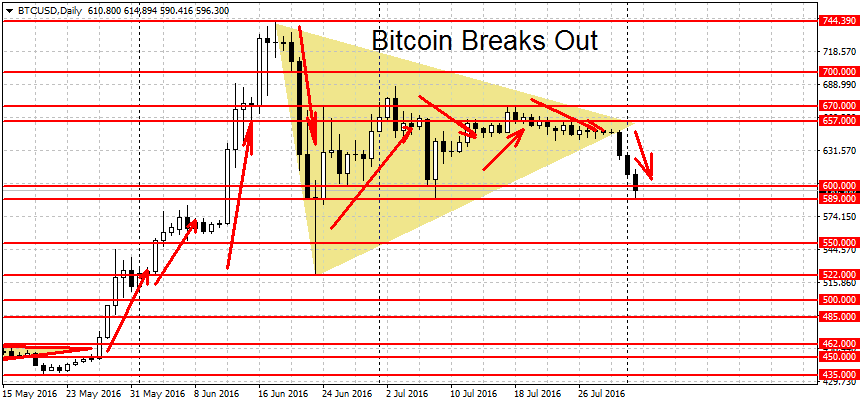
To end the newly started downtrend, prices will have to break $657 on FXOpen ($665 on other exchanges). A new uptrend requires the breakout above $670 ($690 on other exchanges). The longer-run trends for BTC/USD, both weekly and monthly, are still bullish.
From a fundamental perspective, it’s possible that Bitcoin’s recent losses are partially caused by the resurgent Yuan. The USD/CNH fell from $6.68 to $6.62 last week. While this week we’ve seen some retracement, we’re currently quoted at $6.64 per one Yuan, much lower than $6.71 seen just 11 days ago. Bitcoin has exhibited a slightly positive correlation with USD/CNH. In other words, Yuan weakness tends to lead to BTC gains while CNY strength leads to losses.
Litecoin Continues Slide
Alternative cryptocurrency Litecoin continues a slow slide downward. We’re currently quoted at $3.73 per coin. This is lower by 16 cents or just over 4 percent since last week.
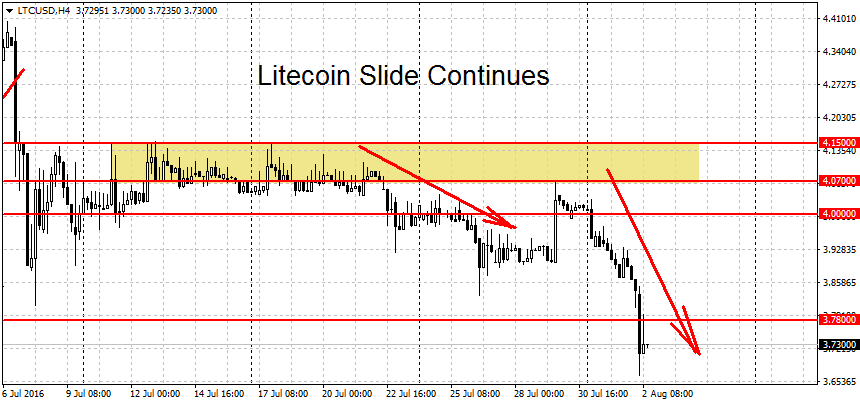
The level to watch is $4.07 per coin. A breakout above this swing high could end the current downtrend. Higher up the $4.15 resistance is another notable level. A clean move above $4.16 may start a new LTC uptrend. More resistance levels above can be found at $4.40 and the $4.50-$4.52 resistance area. These are followed by the November spike high at $4.85 and the round figures of $5 and $5.50. This year’s high for Litecoin at $5.86 is another key level to watch.
On the lower end, the first support is an area from $3.50 to $3.61. A clearing of this area could lead to more losses toward $3.30. The weekly trend for LTC is up while the monthly trend is neutral.
FXOpen offers the world's most popular cryptocurrency CFDs*, including Bitcoin and Ethereum. Floating spreads, 1:2 leverage — at your service (additional fees may apply). Open your trading account now or learn more about crypto CFD trading with FXOpen.
*Important: At FXOpen UK, Cryptocurrency trading via CFDs is only available to our Professional clients. They are not available for trading by Retail clients. To find out more information about how this may affect you, please get in touch with our team.
This article represents the opinion of the Companies operating under the FXOpen brand only. It is not to be construed as an offer, solicitation, or recommendation with respect to products and services provided by the Companies operating under the FXOpen brand, nor is it to be considered financial advice.
Stay ahead of the market!
Subscribe now to our mailing list and receive the latest market news and insights delivered directly to your inbox.


Latest articles

NZD/USD: Inflation Surge Meets Strong US Dollar Pressure
On 21 July, Stats NZ reported an acceleration in inflation: the Consumer Price Index rose 1.5% in the second quarter, while the annual inflation rate climbed to 4.1%, its highest level in more than two years and slightly

Weekly Market Insights with Gary Thomson: The Week of Central Banks and Earnings
In this video, we’ll explore the key economic events and market trends, shaping the financial landscape. Get ready for insights into financial markets to help you navigate the week ahead. Let’s dive in!
In this episode of Market

Intel at a Crossroads: Earnings Beat Meets Technical Resistance
Intel has just delivered its strongest quarter in over fifteen years, and the market reaction says it all. Q2 2026 revenue surged 25% year-over-year to $16.1 billion, crushing the consensus estimate of $14.42 billion, while adjusted EPS of