


Bitcoin Falls $1,026 Dollars From Highs
FXOpen

Bitcoin fell a large $1,026 dollars from the highs reached last Thursday. Litecoin also dropped by a massive 56 percent during the three days of bitcoin decline last week. Both coins have now recovered about 40-50% of the losses.
Bitcoin Falls $1,026 Dollars From Highs
Bitcoin prices fell by a whopping $1,026 dollars from the highs to the lows reached on May 27th. Prices got very close to the potentially trend-ending level of $1,700 on FXOpen but narrowly missed it by bottoming out at $1,710 dollars. We are currently quoted around the 50 percent retracement mark at $2,230 dollars per coin.
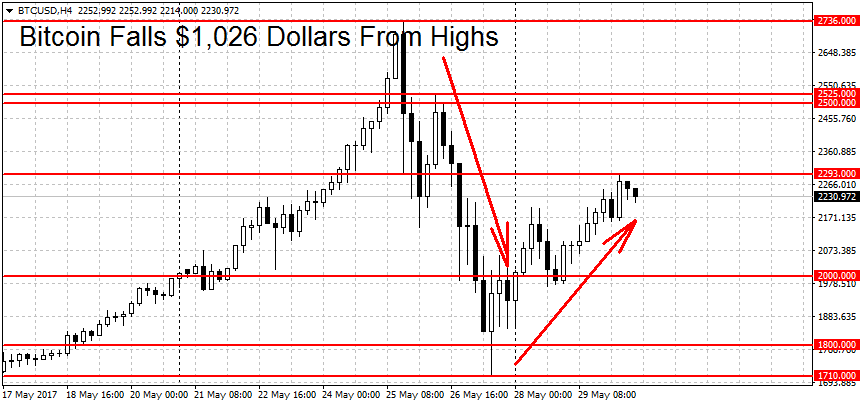
This means that despite the losses, the daily trend remains up. To end it the bears will need to make a decisive push below the $1,700 figure. As usual with these levels we’re looking for a sustained movement not just a brief and shallow spike. A new downtrend needs a move below the $1,583 swing low.
Weak resistance higher up can be found at today’s high of $2,293 followed by the $2,500 round figure. But a much stronger level will be the all-time high at $2,736. A breakout above here could lead to more gains. On the lower end, we have support at the $2,000 round level followed by $1,710, $1,583 and $1,500 dollars. The February swing high at $1,269 should now turn from resistance to support. On the long-term charts (both weekly and monthly) the trend remains up.
Litecoin Trend Turns Bearish
Litecoin followed big brother lower, falling by a large 56 percent in three days. Prices have entered a bearish trend on May 27th with the drop below the $20 round figure. Prices have since bounced back somewhat and LTC/USD is now trading at $25.20 dollars per coin.
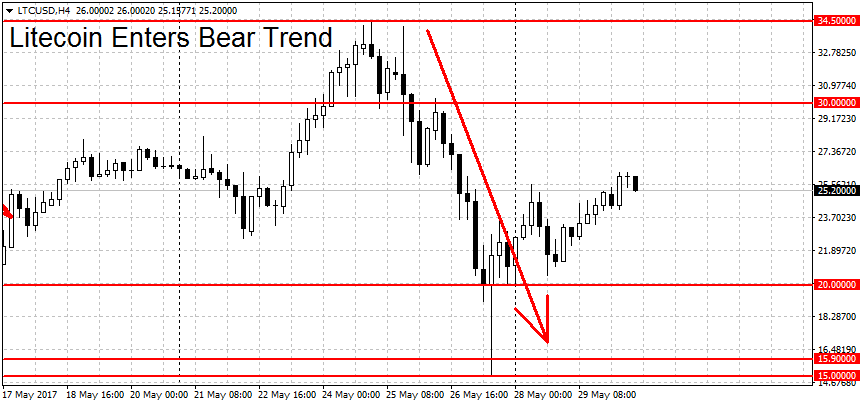
Despite the bounce, the daily trend remains down. A breakout above the $34.50 level is needed to end it and shift us into rally mode. On the longer-term weekly and monthly charts LTC is still bullish.
Support below can be found at the $20 round figure, followed by previous resistance now turned support area around $16 dollars. Further down the low of the most recent crash low at $15 is another notable level. A drop below here could exacerbate the losses. Higher up we have resistance at $30 round figure followed by the $34.48 swing high and the multi-year high at $36.25. A breakout above here may lead to an extended move higher.
Trade cryptocurrency with FXOpen broker.
FXOpen offers the world's most popular cryptocurrency CFDs*, including Bitcoin and Ethereum. Floating spreads, 1:2 leverage — at your service (additional fees may apply). Open your trading account now or learn more about crypto CFD trading with FXOpen.
*Important: At FXOpen UK, Cryptocurrency trading via CFDs is only available to our Professional clients. They are not available for trading by Retail clients. To find out more information about how this may affect you, please get in touch with our team.
This article represents the opinion of the Companies operating under the FXOpen brand only. It is not to be construed as an offer, solicitation, or recommendation with respect to products and services provided by the Companies operating under the FXOpen brand, nor is it to be considered financial advice.
Stay ahead of the market!
Subscribe now to our mailing list and receive the latest market news and insights delivered directly to your inbox.


Latest articles

DAX 40: consolidation amid technology sell-off
A wave of selling in the technology sector that emerged earlier this week has weighed on European equities. The trigger was investor concern over the profitability of large-scale debt-funded investments by major US tech companies in AI infrastructure. The Nasdaq

Euro Hits Fresh Yearly Lows Amid Dovish ECB Signals
The euro remains under pressure following weak macroeconomic data from the euro area and fresh signals that the European Central Bank is prepared to maintain a more accommodative monetary policy stance. Data released yesterday pointed to a deterioration in business

Pound at Key Levels: Markets Assess Impact of Political Uncertainty in the UK
The British pound remains under pressure following increased political uncertainty in the United Kingdom triggered by the Prime Minister’s resignation. Investors are assessing potential shifts in the political and economic policy outlook after the head of government stepped down,