


Bitcoin Falls on Auction Results
FXOpen

Bitcoin prices fell today after the news that the latest auction attracted only 5 bidders. This compares to 11 bids last November.
Bitcoin down Today but up on the Week
While Bitcoin is up by $20 during the past seven days, prices have fallen today on the weak auction results. As usual both the identity of the winner and the price per BTC paid is unknown, so the only stat we have to go by is the number of bids. Logically, a lower number is likely to mean lower bidding prices. You can read more about the auction HERE.
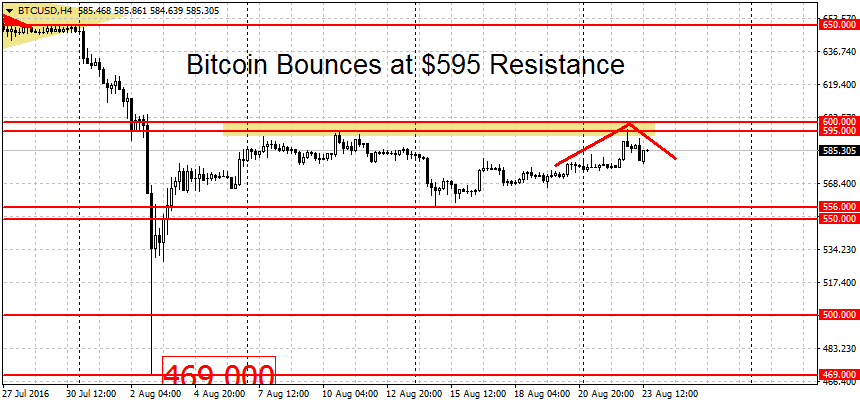
Technically, we’re still in a downtrend. Prices did (very briefly) break the $595 figure, posting a high of $596.27. But as we said last week, we are looking for a decisive break of the level. For extra conviction, a break of $600 would help. A move above here would switch the short-term trend from down to up.
Resistance levels above here can be found at the next round figure of $650 mark followed by $670, $687 and $700 per coin. Both the medium-term and the long-term trends remain to the upside.
On the downside, a weak support can be found in the $556 area, followed by the round $500 figure. But a stronger support level is the breakout level for the recent rally around $460-$469 per coin. Adding more validity to the level, this is where prices bottomed out in panic after the Bitfinex hack. A break below here could lead to more losses.
Litecoin Surging Over 5 Percent
Litecoin has surged over 5 percent today, from $3.64 to $3.85 per coin. This has put a stop to the downtrend which lasted over 2 months. We’re now in kind of a no-mans land although from these levels a rally is more likely than a decline.
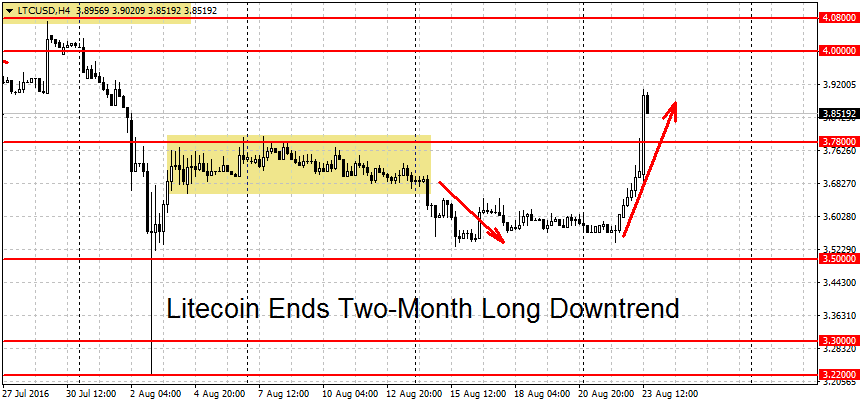
A break of the $4 round figure could start a new LTC uptrend. Resistance levels above can be found at the $4.07 swing high, followed by $4.15. Higher up we have a cluster of resistance levels spanning from $4.43 to $4.52 per coin. A clean break above this area could intensify the gains.
On the lower end, we need a break of the $3.50 level to restart the downtrend. Below here we have a support at the $3.22 post-hack lows followed by the $3 round figure and this year’s low at $2.89. The twelve-month low near $2.50 per coin is another notable support level. With the recent end of the short-term downtrend, now all the 3 trends (short-, medium- and long-term) are in a neutral territory.
FXOpen offers the world's most popular cryptocurrency CFDs*, including Bitcoin and Ethereum. Floating spreads, 1:2 leverage — at your service (additional fees may apply). Open your trading account now or learn more about crypto CFD trading with FXOpen.
*Important: At FXOpen UK, Cryptocurrency trading via CFDs is only available to our Professional clients. They are not available for trading by Retail clients. To find out more information about how this may affect you, please get in touch with our team.
This article represents the opinion of the Companies operating under the FXOpen brand only. It is not to be construed as an offer, solicitation, or recommendation with respect to products and services provided by the Companies operating under the FXOpen brand, nor is it to be considered financial advice.
Stay ahead of the market!
Subscribe now to our mailing list and receive the latest market news and insights delivered directly to your inbox.


Latest articles

US Dollar Index: A Defining Week for the King of the Markets
The dollar heads into a pivotal week trading near 101.80, just off a 15-month high, with the Fed's July 29 meeting standing as the clear focal point. Markets currently price roughly a 65% chance of a hold, though renewed

NZD/USD: Inflation Surge Meets Strong US Dollar Pressure
On 21 July, Stats NZ reported an acceleration in inflation: the Consumer Price Index rose 1.5% in the second quarter, while the annual inflation rate climbed to 4.1%, its highest level in more than two years and slightly

Weekly Market Insights with Gary Thomson: The Week of Central Banks and Earnings
In this video, we’ll explore the key economic events and market trends, shaping the financial landscape. Get ready for insights into financial markets to help you navigate the week ahead. Let’s dive in!
In this episode of Market