


Bitcoin Higher, Litecoin Surges to $9
FXOpen
Both of the coins we follow on Tuesdays are up since the last update. Bitcoin is trading at $1,147 right now, up from $1,057 last Tuesday. It’s’ little brother Litecoin is up substantially to $9.03 on segwit implementation hopes. As usual, we will first cover bitcoin then come back to LTC later in the article.
Bitcoin Ends Downtrend
With a non-stop rally during the previous seven days bitcoin has ended the downtrend and is now back in neutral mode. The daily chart below shows the large range we’re trading in right now.
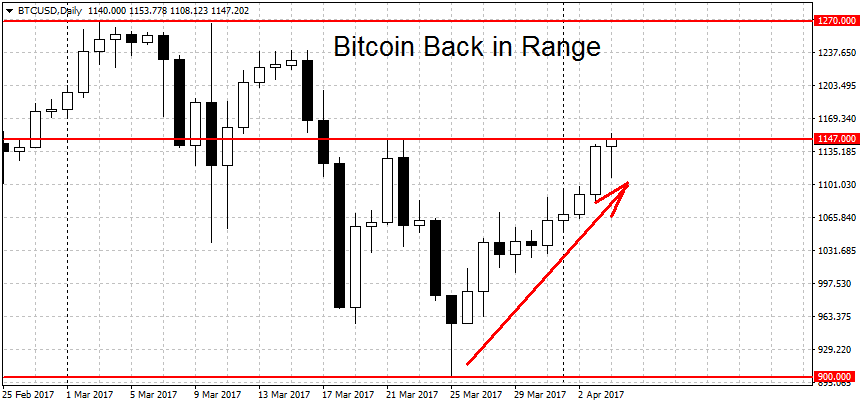
A new bull market requires a breakout above the $1,270 highs. A new bear market would be in force on a break below $900 dollars. This is slightly below last month’s lows at $901 per coin. On the longer-term (both weekly and monthly) charts BTC/USD is still in bullish territory.
Litecoin Doubles on Segwit Hopes
Litecoin prices more than doubled to $9.03 from $4.12 during our previous update. This extended the rally into new territory.
A primary driver behind the jump is the hopes that segwit for Litecoin will be activated. The largest LTC pool, F2Pool, started signaling for segwit on March 31st. By this time prices have already moved from $4.2 to over $7 dollars per coin, showing insider knowledge of the decision. Earlier today a small pool, Batpool, started signaling segwit as well, bringing us closer to the 75% threshold needed to activation. Currently, around 62% of all LTC mining is signaling for segwit.
Fundamentally doubts remain about the sustainability of this rally. The main benefit of segwit for bitcoin is seen in shrinking the footprint of the blocks, thereby allowing more transactions. But unlike bitcoin, litecoin’s network is not congested. It’s possible that the magnitude of the gains was amplified by the ongoing climate of pumps in the altcoin market. In prior weeks we saw the price of Dash increase by 10 times and the price of Ether by a factor of five. Those two coins are now down substantially from their peaks.
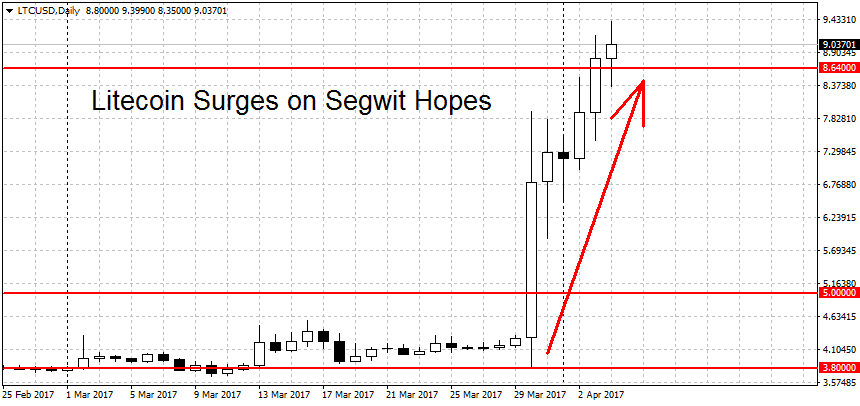
Technically you can’t argue that the charts are still bullish here. In fact, the latest surge higher was so strong that it shifted LTC/USD into a bull market on the weekly and monthly charts as well. With the surge above the halving high at $8.64, no clear resistance levels can be seen above. The round figures at $10, $15 and $20 are obvious choices here.
On the other end, a break below the $3.80 lows is needed to end the current uptrend and start a new downtrend. As usual with these figures, we’re looking for a sustained move, not just a brief and shallow spike below the level.
FXOpen offers the world's most popular cryptocurrency CFDs*, including Bitcoin and Ethereum. Floating spreads, 1:2 leverage — at your service (additional fees may apply). Open your trading account now or learn more about crypto CFD trading with FXOpen.
*Important: At FXOpen UK, Cryptocurrency trading via CFDs is only available to our Professional clients. They are not available for trading by Retail clients. To find out more information about how this may affect you, please get in touch with our team.
This article represents the opinion of the Companies operating under the FXOpen brand only. It is not to be construed as an offer, solicitation, or recommendation with respect to products and services provided by the Companies operating under the FXOpen brand, nor is it to be considered financial advice.
Stay ahead of the market!
Subscribe now to our mailing list and receive the latest market news and insights delivered directly to your inbox.


Latest articles

US Dollar Index: A Defining Week for the King of the Markets
The dollar heads into a pivotal week trading near 101.80, just off a 15-month high, with the Fed's July 29 meeting standing as the clear focal point. Markets currently price roughly a 65% chance of a hold, though renewed

NZD/USD: Inflation Surge Meets Strong US Dollar Pressure
On 21 July, Stats NZ reported an acceleration in inflation: the Consumer Price Index rose 1.5% in the second quarter, while the annual inflation rate climbed to 4.1%, its highest level in more than two years and slightly

Weekly Market Insights with Gary Thomson: The Week of Central Banks and Earnings
In this video, we’ll explore the key economic events and market trends, shaping the financial landscape. Get ready for insights into financial markets to help you navigate the week ahead. Let’s dive in!
In this episode of Market