


FXOpen
Bitcoin hit the $1,000 mark on most Bitcoin exchanges. Prices got as high as $997 on FXOpen before falling back down. It’s little brother is not doing as great. Litecoin prices are up but still below the December 24th high.
Bitcoin hits the Triple Zero
Bitcoin hit the triple zero mark ($1,000) for the first time since December of 2013. Prices peaked around $1,030 – $1,040 on most USD sites and currently remain somewhat above this important figure. On FXOpen we hit a high of $997.50 yesterday and are now sitting just slightly below it at $982 dollars per coin.
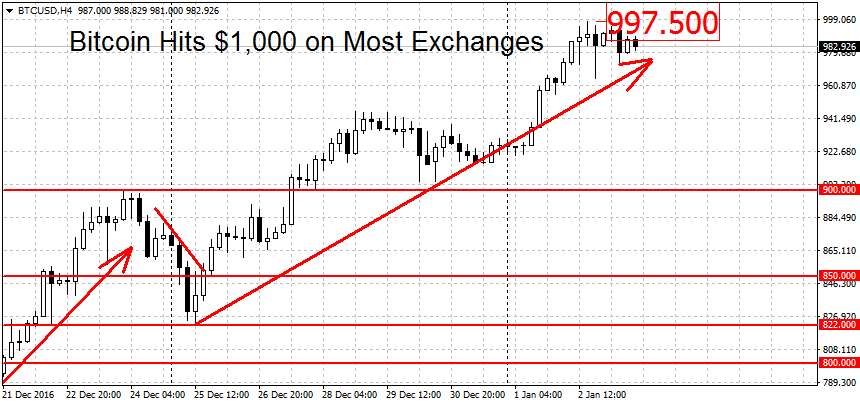
Like we mentioned in our previous article, during major bull runs like these, the usual state of affairs is to have the Chinese sites trade at a premium to USD exchanges, with FXOpen at the bottom. FXOpen is lagging the US market by $37 right now. Historically this price gap has been as high as $50 this year. Note that if we start crashing, the Chinese sites usually fall disproportionately more then US exchanges.
On the technical front, the bullish trend is naturally still in place. To end it, the bears will have to push BTC/USD below the $822 swing low (FXOpen). This low corresponded to $840-$850 on most other USD sites. The bar for setting a new downtrend on FXOpen is set a bit lower at $760, below the latest BTC breakout point near $773 dollars. All three trends for bitcoin (short-term, medium-term and long-term) remain bullish.
Litecoin Lags Behind
Litecoin prices are up by 24 cents to $4.33 right now, a move of 5.88 percent. While this is a fair amount, it lags behind bitcoin’s gain of $101 or 11.56 in percentage terms.
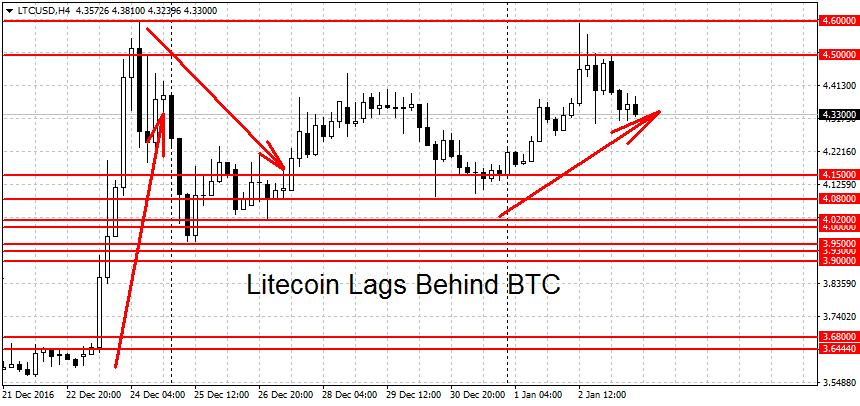
Nonetheless, the LTC trend is still up and to end it, prices will have to fall below the $3.95 swing low. For a fresh downtrend the bar is set much lower at the $3.50 round figure. In between these levels we have weaker support at $4.08, $4 and the area around $3.64-$3.68.
On the upside we have weak resistance near $4.50 followed by a much stronger double top near $4.60. Prices peaked here on December 24th and again on January 2nd, only to be strongly rejected both times. A decisive breakout above here could lead to more gains. For LTC/USD the short-term and medium-term trends are bullish but the long-term trend is still neutral.
FXOpen offers the world's most popular cryptocurrency CFDs*, including Bitcoin and Ethereum. Floating spreads, 1:2 leverage — at your service. Open your trading account now or learn more about crypto CFD trading with FXOpen.
*At FXOpen UK and FXOpen AU, Cryptocurrency CFDs are only available for trading by those clients categorised as Professional clients under FCA Rules and Professional clients under ASIC Rules respectively. They are not available for trading by Retail clients.
This article represents the opinion of the Companies operating under the FXOpen brand only. It is not to be construed as an offer, solicitation, or recommendation with respect to products and services provided by the Companies operating under the FXOpen brand, nor is it to be considered financial advice.
Stay ahead of the market!
Subscribe now to our mailing list and receive the latest market news and insights delivered directly to your inbox.

Latest articles

Weekly Market Wrap With Gary Thomson: Nasdaq, EUR/USD, USD/CHF, Brent Crude Oil, Googl Shares
Get the latest scoop on the week's hottest headlines, all in one convenient video. Join Gary Thomson, the COO of FXOpen UK, as he breaks down the most significant news reports and shares his expert insights.
- Nasdaq Composite: Worst Session

Analysis of AUD/USD: Exchange Rate Falls to Early May Low
As indicated by the 4-hour AUD/USD chart today:
→ the rate fell below 0.652, a level last seen on May 2;
→ the RSI indicator dropped below 15, a level last seen during the panic over the spread of COVID-19

Analysis of AMZN Stock: Price at 1.5-Month Low
As shown in the AMZN chart, the stock price dropped below:
→ the psychological level of $180;
→ the mid-June interim low.
The last time AMZN traded below $180 was in early June.
Thus, AMZN has faced sell-offs, similar to other tech