


FXOpen
Bitcoin prices hit new monthly lows of $5,883 dollars before stabilizing somewhat. Litecoin hit a new 2018 low yesterday at $49.10 dollars before rallying higher. It’s quoted at $54 dollars right now.
Bitcoin Hits Monthly Lows
As noted above BTC/USD hit new lows for this month before stabilizing. We are trading at $6,330 at the moment, not far from the $6,488 dollars quoted last week.
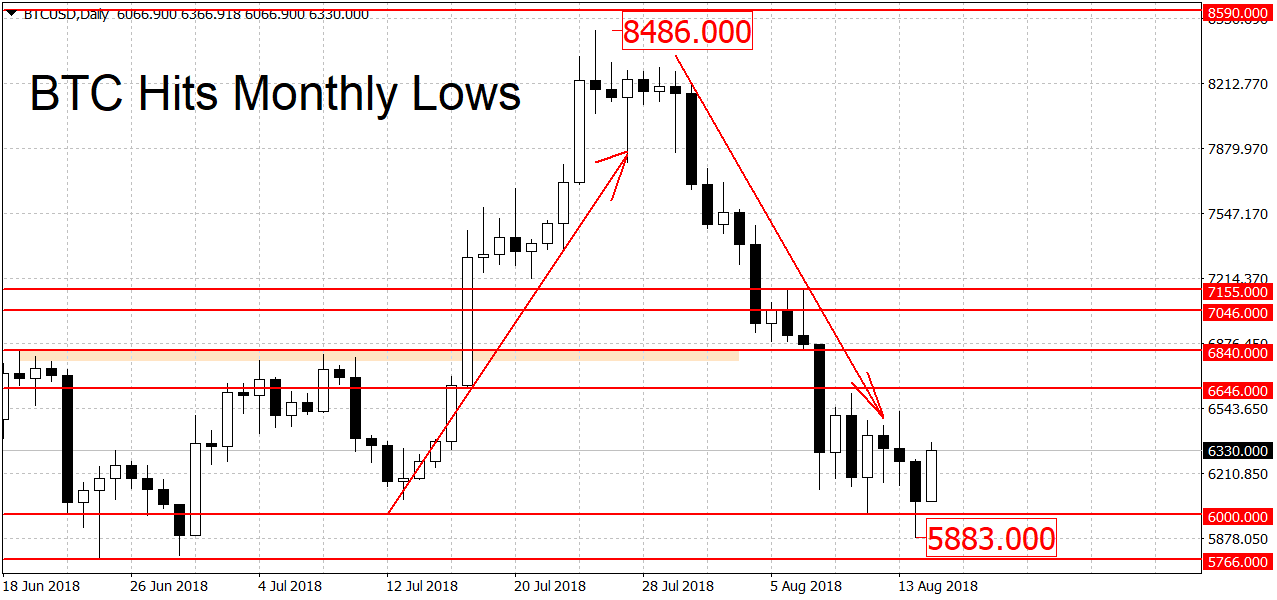
In that article we said that the $5,700 to $6,000 area will provide some support. This is exactly where the current downmove decided to stall. A decisive clearing of this area should open the door to the $5,000 round figure. The latest bounce seems like a dead-cat. The lack of a fundamental driver coupled with the relatively small gains shouldn’t give much hope for an extended move.
The bulls need a breakout above the $7,155 swing high to end the downtrend. Other potential resistance levels that can be seen on the chart above are $6,622, $6,840 and $7,212 dollars per coin. A move beyond the two-month high at $8,486 dollars could start a new rally in prices. On the longer-term charts there’s no change since last week. The weekly chart is bearish while the monthly is still keeping a slight bullish bias.
Litecoin Bounces at 2013 Top
Litecoin prices almost hit the 2013 top yesterday. We traded as low as $49.10, missing the $48.40 high by only $0.7 dollars or 1.4 percent. We are currently quoted bit higher at $54.88 dollars.
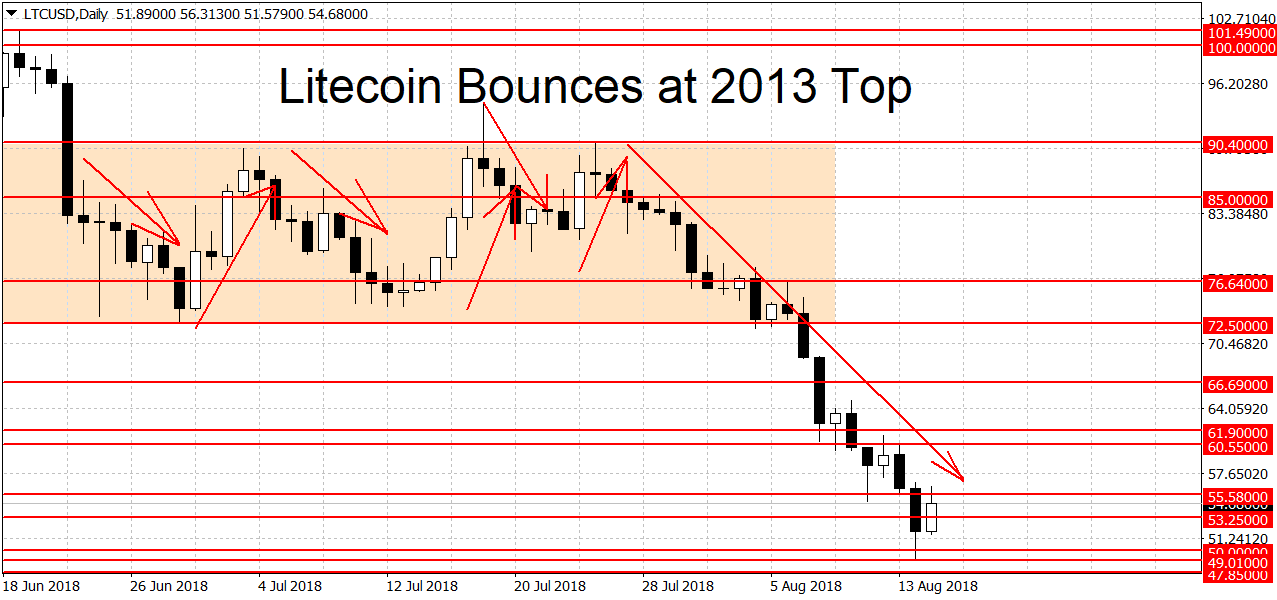
The bounce for LTC/USD around $50 dollars was expected. In our last article we pinned this area as strong support. Like we said back then, here we have the 2013 high at $48.40 dollars coupled with the $50 round figure. That 2013 high wasn’t broken until July of 2017. Because resistance turns to support, you would expect some pushback when this level is tested. A clean break below $48.40 could lead to extended losses.
The downtrend will remain in place until we clear the $76.64 swing high. A breakout above $90.40 dollars is needed for a new rally. More resistance in between these two levels can be seen at $72.50 and $85 dollars. On the longer-term charts, the picture for LTC is the same as bitcoin, bearish on the weeklies but slightly bullish on the monthly charts.
Trade bitcoin on FXOpen Crypto accounts.
FXOpen offers the world's most popular cryptocurrency CFDs*, including Bitcoin and Ethereum. Floating spreads, 1:2 leverage — at your service. Open your trading account now or learn more about crypto CFD trading with FXOpen.
*At FXOpen UK and FXOpen AU, Cryptocurrency CFDs are only available for trading by those clients categorised as Professional clients under FCA Rules and Professional clients under ASIC Rules respectively. They are not available for trading by Retail clients.
This article represents the opinion of the Companies operating under the FXOpen brand only. It is not to be construed as an offer, solicitation, or recommendation with respect to products and services provided by the Companies operating under the FXOpen brand, nor is it to be considered financial advice.
Stay ahead of the market!
Subscribe now to our mailing list and receive the latest market news and insights delivered directly to your inbox.

Latest articles

Weekly Market Wrap With Gary Thomson: Nasdaq, EUR/USD, USD/CHF, Brent Crude Oil, Googl Shares
Get the latest scoop on the week's hottest headlines, all in one convenient video. Join Gary Thomson, the COO of FXOpen UK, as he breaks down the most significant news reports and shares his expert insights.
- Nasdaq Composite: Worst Session

Analysis of AUD/USD: Exchange Rate Falls to Early May Low
As indicated by the 4-hour AUD/USD chart today:
→ the rate fell below 0.652, a level last seen on May 2;
→ the RSI indicator dropped below 15, a level last seen during the panic over the spread of COVID-19

Analysis of AMZN Stock: Price at 1.5-Month Low
As shown in the AMZN chart, the stock price dropped below:
→ the psychological level of $180;
→ the mid-June interim low.
The last time AMZN traded below $180 was in early June.
Thus, AMZN has faced sell-offs, similar to other tech