


Bitcoin in Range After Tether Panic
FXOpen
Despite some drama during the week, bitcoin is still stuck in a range. We are quoted at $6,545 right now, only marginally lower compared to last week’s price of $6,633 dollars.
Bitcoin Still in Range
The price of bitcoin is still in a range on the daily chart. Compared to last week we’re down by only $88 dollars or 1.3 percent. Naturally this wasn’t enough to trigger a change in trend.
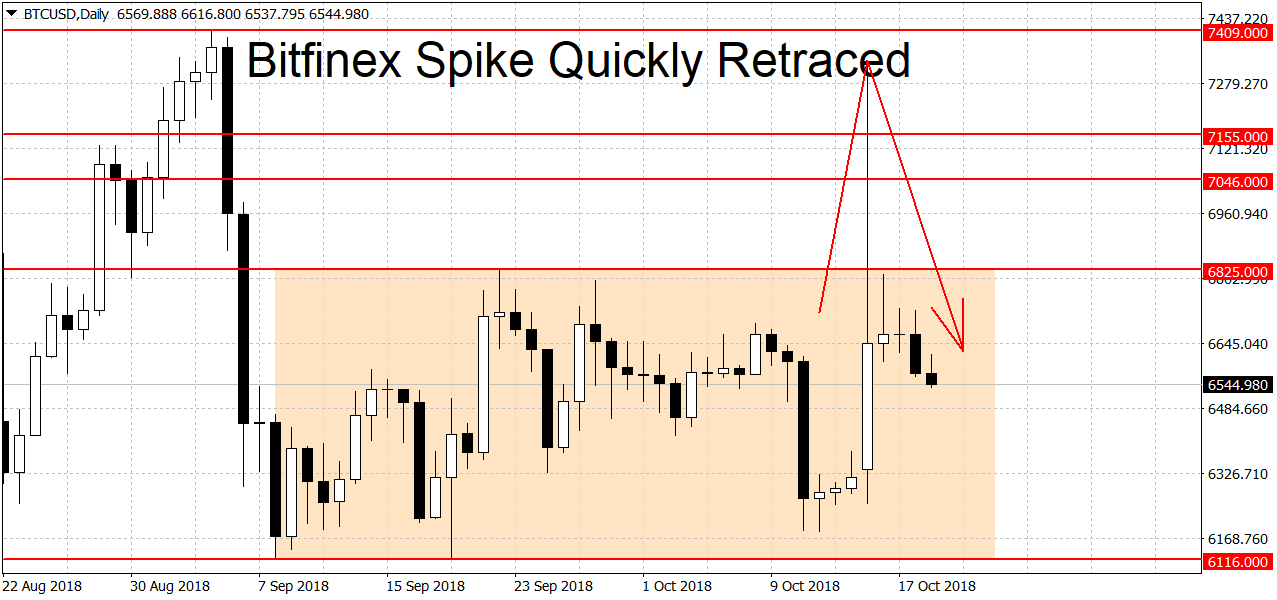
On FXOpen there was a sharp short-lived spike above $7,000, reaching a high of $7,335 dollars at one point. This was due to a mini bank-run on Bitfinex. As the price of Tether plummeted to 85 cents on the dollar, panicked traders bought bitcoin to get their money out of Bitfinex as soon as possible. The exchange recently lost another banking partner and users are reporting delayed or rejected fiat withdrawals.
Bitfinex and Tether Relationship
The troubled company has been having problems maintaining stable banking relationships, leading to frequent fiat withdrawal issues over the past two years. Some of the owners of Bitfinex have ownership in Tether as well. Knowledgeable crypto users claim that Bitfinex basically owns Tether. Fiat currency and Tether are interchangeable on Bitfinex, in other words any Tether deposited at the exchange can be withdrawn to a bank account as USD.
Naturally this leads to a close price relationship between the two, the bitcoin price on Bitfinex tends to be around the real market price of bitcoin / the price of tether. For example right now at Bitstamp one bitcoin is selling for $6,371 dollars while on Coinbase it’s quoted at $6,375 dollars. This makes the average price around $6,373 for exchanges not having withdrawal issues. We now divide that by $0.9653 which is the price of Tether on the most liquid USDT/USD pair at Kraken. We get a price of $6,602 dollars, very close to the current price at Bitfinex of $6,582 dollars.
On Tuesday the site announced a new ‘innovative’ solution to its banking problems but this failed to calm markets, as we can see Tether is still ‘untethered’ from $1 dollar.
Technical Picture Unchanged
Back to the technicals. Here the picture is unchanged. We can ignore the price spike above 7k because it was in response to the bank run at Bitfinex. During times of turmoil you should always look at where other large bitcoin exchanges are trading, especially Bitstamp and Coinbase, which seem to have been the most stable during the past few years in terms of fiat withdrawals and general liquidity.
On these two exchanges the spike stopped at $6,756 and $6,810 dollars. This is below the $6,825 price point we noted last week as a potential rally starter. On the downside we’re looking at the double bottom of $6,116 dollars. A decisive breakdown below here could start a new downtrend on the daily charts. On the long-term charts the situation is unchanged, Bitcoin is slightly bearish on the weeklies and slightly bullish on the monthlies.
Open a Crypto account with FXOpen and start BTC trading.
FXOpen offers the world's most popular cryptocurrency CFDs*, including Bitcoin and Ethereum. Floating spreads, 1:2 leverage — at your service (additional fees may apply). Open your trading account now or learn more about crypto CFD trading with FXOpen.
*Important: At FXOpen UK, Cryptocurrency trading via CFDs is only available to our Professional clients. They are not available for trading by Retail clients. To find out more information about how this may affect you, please get in touch with our team.
This article represents the opinion of the Companies operating under the FXOpen brand only. It is not to be construed as an offer, solicitation, or recommendation with respect to products and services provided by the Companies operating under the FXOpen brand, nor is it to be considered financial advice.
Stay ahead of the market!
Subscribe now to our mailing list and receive the latest market news and insights delivered directly to your inbox.


Latest articles

EUR/USD Eyes Gains As USD/CHF Weakness Deepens Again
EUR/USD started a fresh increase above 1.1700 and 1.1720. USD/CHF declined further and is now struggling below 0.7835.
Important Takeaways for EUR/USD and USD/CHF Analysis Today
· The Euro started a decent increase from

Apple: Earnings Day Above the Activity Zone
On 30 April, after the market close, Apple Inc. will release its financial results for the second quarter of fiscal 2026. The consensus forecast, based on estimates from 31 analysts, points to revenue of around $109.7 billion, with expected

USD/JPY and USD/CHF Near Key Levels: The Dollar Supported by the Fed
The US dollar continues to trend upwards following the Federal Reserve meeting, drawing support from the regulator’s moderately hawkish stance and comments by Jerome Powell. Markets interpret the Fed’s rhetoric as a signal that restrictive policy is likely