


Bitcoin, Litecoin at New All-Time Highs Dec 2017
FXOpen

Both of the cryptos we follow on Tuesdays have hit new all-time highs. Bitcoin peaked at $11,950 dollars today while LTC/USD topped out at $105.30 two days ago.
Bitcoin Clears $10,000 Dollars
After fighting with the $10,000 level for a few days BTC finally managed to clear it and head higher. Today we hit a high of $11,950 before a daily retracement took us back down to $11,461 dollars per coin. We are currently quoted close to the daily highs at $11,712 dollars.
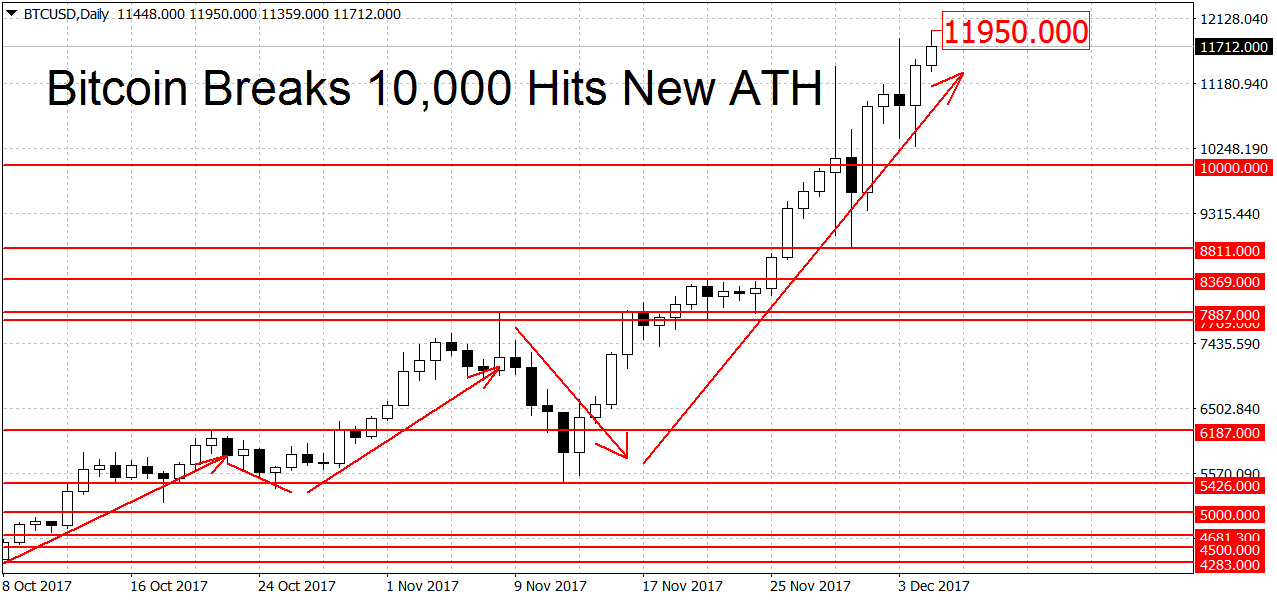
The rally that started three weeks ago is still in play. To end it we need to see a break below the $8,650 level. Just above here we should have solid support at the $8,811 swing low, followed by the $10,000 round figure. Considering that we’re near all-time highs for BTC/USD, there’s not much resistance on the upper end. Today’s high at $11,950 as well as $12,000 may provide some resistance. Further up the $15,000 round level is another notable resistance. The ‘smaller’ round levels at $13,000 and $14,000 may act as resistance as well. On the long-term charts (both weekly and monthly) bitcoin remains in a bull market.
Bitcoin got a lift from a positive news cycle this weekend. The CBOE futures exchange announced that it will list bitcoin futures on December 10th, eight days before the launch of CME futures. The sudden decision to launch early seeks to seize the first-mover advantage in this emergent asset class. Trading will start on Sunday at 18:00 EST. Initially, trading fees will be waived during December. The CBOE futures will be listed under the ticker XBT and will cash-settle based on the Gemini auction.
Litecoin Also at New All-Time Highs
Litecoin prices are near all-time highs as well, after peaking at $105.30 two days ago. We are currently trading just below the $100 round figure.
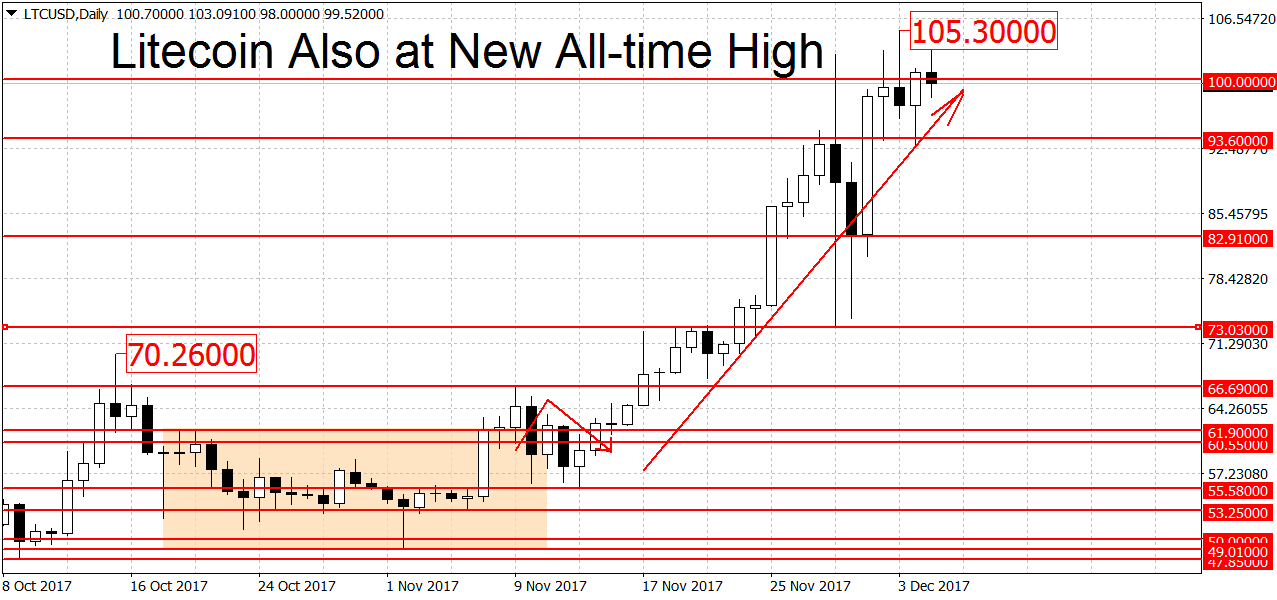
Litecoin is still in an uptrend here. To end the rally on the daily charts the bears will have to push LTC/USD below the $73.03 swing low. Support below here can be found in the area around the $66.69 level. Here we have the former swing high at $66.69 and the swing low at $67.51 dollars. A decisive breakdown below here could start a new LTC downtrend.
On the upside, we have weak resistance around the $100 round figure, followed by more resistance at the $105.30 all-time high. Similarly to BTC, litecoin is looking bullish on both the weekly and monthly timeframes.
Start mt4 bitcoin trading with FXOpen broker.
FXOpen offers the world's most popular cryptocurrency CFDs*, including Bitcoin and Ethereum. Floating spreads, 1:2 leverage — at your service (additional fees may apply). Open your trading account now or learn more about crypto CFD trading with FXOpen.
*Important: At FXOpen UK, Cryptocurrency trading via CFDs is only available to our Professional clients. They are not available for trading by Retail clients. To find out more information about how this may affect you, please get in touch with our team.
This article represents the opinion of the Companies operating under the FXOpen brand only. It is not to be construed as an offer, solicitation, or recommendation with respect to products and services provided by the Companies operating under the FXOpen brand, nor is it to be considered financial advice.
Stay ahead of the market!
Subscribe now to our mailing list and receive the latest market news and insights delivered directly to your inbox.


Latest articles

Weekly Market Insights with Gary Thomson: The Week of Central Banks and Earnings
In this video, we’ll explore the key economic events and market trends, shaping the financial landscape. Get ready for insights into financial markets to help you navigate the week ahead. Let’s dive in!
In this episode of Market

Intel at a Crossroads: Earnings Beat Meets Technical Resistance
Intel has just delivered its strongest quarter in over fifteen years, and the market reaction says it all. Q2 2026 revenue surged 25% year-over-year to $16.1 billion, crushing the consensus estimate of $14.42 billion, while adjusted EPS of

Tesla: Complex Range Structure Breaks Down Following Quarterly Earnings
Tesla released its Q2 2026 results after the market closed on 22 July. Revenue increased 26% year-on-year to $28.24 billion, while vehicle deliveries reached a record 480,126 units. However, operating margin fell sharply to 1.4%, down from