


Bitcoin, Litecoin Continue Downtrends May 2018
FXOpen
Both bitcoin and litecoin are continuing their downtrends. Bitcoin is quoted at $8,290 right now, lower by 4.5 percent since last Tuesday. Litecoin is trading at $133 dollars, down by 9.5 percent.
Bitcoin Still Bearish
Bitcoin is still looking bearish on the daily charts. On Friday we hit a new interim low of $7,921 but from here we got a bounce to $8,590 dollars. Right now we’re somewhat in between these two figures at $8,290 dollars.
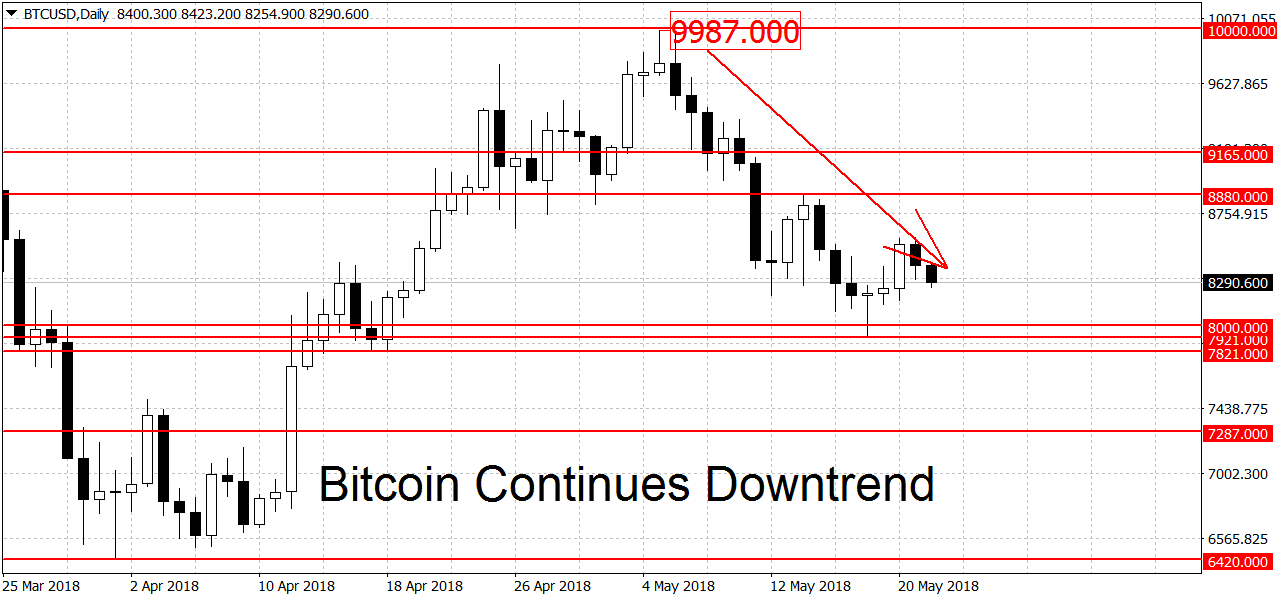
To end the current downtrend the bulls will have to push us above the $8,880 swing high.Resistance higher up can be found at the $9,000 mark followed by the swing highs at $9,387 and $9,759 dollars. All of these levels are weak resistance points however. We have much stronger resistance area around the top of the previous bull run which was at $9,987 dollars. A breakout above the $10,000 round figure is needed to kick-start a new rally.
There’s a support area below between $7,821 and $8,000 dollars. A break of it could lead to extended losses toward the next strong support area in the $6,420 to $6,600 dollars range. This is where we bottomed out during the last major sell-off. A decisive break below here could open the door for a break of this year’s low at $5,980 dollars.
On the fundamental front there haven’t been any major news events during the past seven days. After the end of Consensus 2018 we are in a bit of lull in terms of scheduled news catalysts. There’s no change on the longer-term weekly and monthly charts. The weekly is looking range-bound while the monthly is still bullish.
Litecoin Remains in Downtrend
Similarly to bitcoin, litecoin too remains in a downtrend. We are currently quoted at $133 dollars and trading just above a set of several potential support levels at $130.70, $128.57 and $125 dollars. A clearing of this support area should lead to further losses.
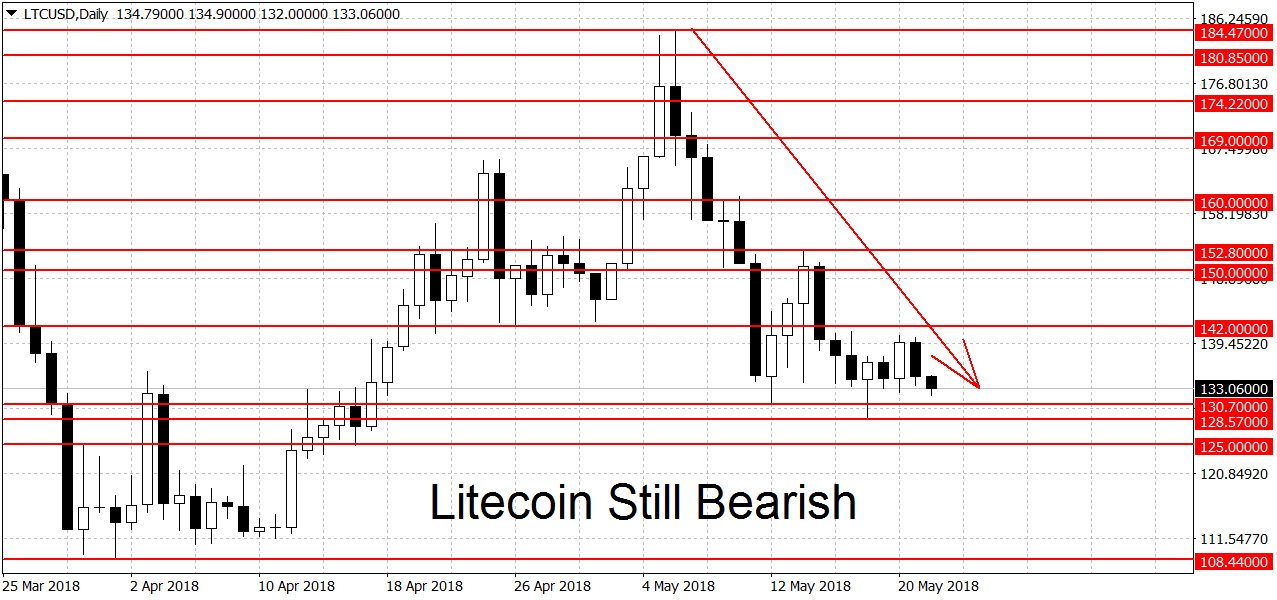
The first strong level of support after this area can be found at the $108.44 swing low. The low for 2018 is close to here at $105.55 dollars, some traders may choose to wait until that level is taken out as well. Further down the $100 round figure may also act as weak support to falling prices.
On the top end we have resistance at $142 dollars followed by the $150 round figure. Higher up a breakout above the $152.80 swing low would end the current bearish trend on the daily charts. A move above the $184.47 swing high is needed for a new LTC rally. On the longer-term weekly and monthly charts LTC/USD is still looking bullish.
FXOpen offers the world's most popular cryptocurrency CFDs*, including Bitcoin and Ethereum. Floating spreads, 1:2 leverage — at your service (additional fees may apply). Open your trading account now or learn more about crypto CFD trading with FXOpen.
*Important: At FXOpen UK, Cryptocurrency trading via CFDs is only available to our Professional clients. They are not available for trading by Retail clients. To find out more information about how this may affect you, please get in touch with our team.
This article represents the opinion of the Companies operating under the FXOpen brand only. It is not to be construed as an offer, solicitation, or recommendation with respect to products and services provided by the Companies operating under the FXOpen brand, nor is it to be considered financial advice.
Stay ahead of the market!
Subscribe now to our mailing list and receive the latest market news and insights delivered directly to your inbox.


Latest articles

Apple: Earnings Day Above the Activity Zone
On 30 April, after the market close, Apple Inc. will release its financial results for the second quarter of fiscal 2026. The consensus forecast, based on estimates from 31 analysts, points to revenue of around $109.7 billion, with expected

USD/JPY and USD/CHF Near Key Levels: The Dollar Supported by the Fed
The US dollar continues to trend upwards following the Federal Reserve meeting, drawing support from the regulator’s moderately hawkish stance and comments by Jerome Powell. Markets interpret the Fed’s rhetoric as a signal that restrictive policy is likely

EUR/USD and GBP/USD consolidate ahead of the Fed decision
European currencies are showing subdued dynamics, entering a consolidation phase following their previous advance. Earlier, EUR/USD and GBP/USD broke out of their ranges and strengthened; however, the subsequent correction has led both pairs to retest the previously breached