


Bitcoin, Litecoin Enter Bullish Territory
FXOpen
After a slow but consistent rally during the past two weeks, both bitcoin and litecoin are now back in bullish territory.
Bitcoin Enters Bullish Territory
Bitcoin is quoted at $7,365 dollars right now, up by $1,060 dollars compared to two weeks ago. Back then one coin was selling for $6,305 dollars. In percentage terms this is a gain of close to 17 percent. The gains seem to be mostly a technical affair, as there were no major positive news during the past few weeks.
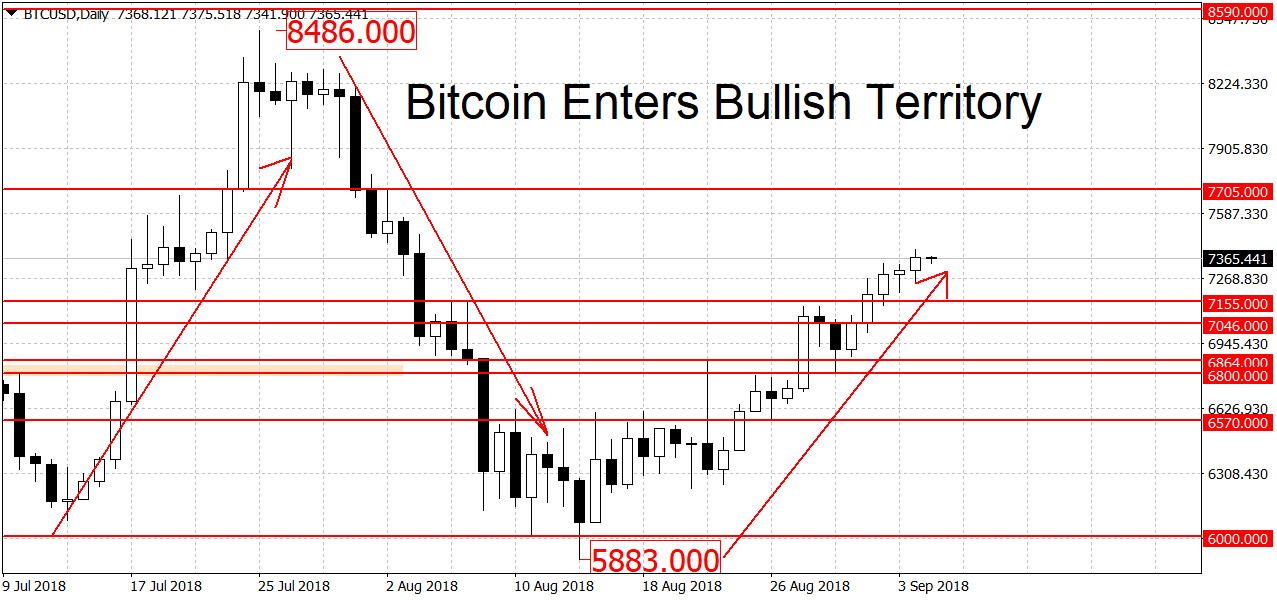
The trend on the daily charts has now switched to bullish. A break below $6,570 dollars is needed to end it. A move beyond the $6,000 round figure could re-awaken the bear. More support on the way down can be seen at $7,155, $7,046, $6,864 and $6,800 dollars per coin. A move below $5,700 could easily lead to a test of the $5,000 price level.
Higher up there’s resistance in the $7,700 to $7,800 area, followed by the $8,000 round figure. The area around the top of the last rally at $8,468 dollars is another potential resistance. The weekly chart for BTC/USD is still bearish. The monthly chart barely held on to the bullish bias.
Litecoin Up 25 Percent
Similarly to big brother, LTC underwent a slow but steady rally during the past two weeks. The coin is up by $13.68 dollars or 25 percent during this timeframe.
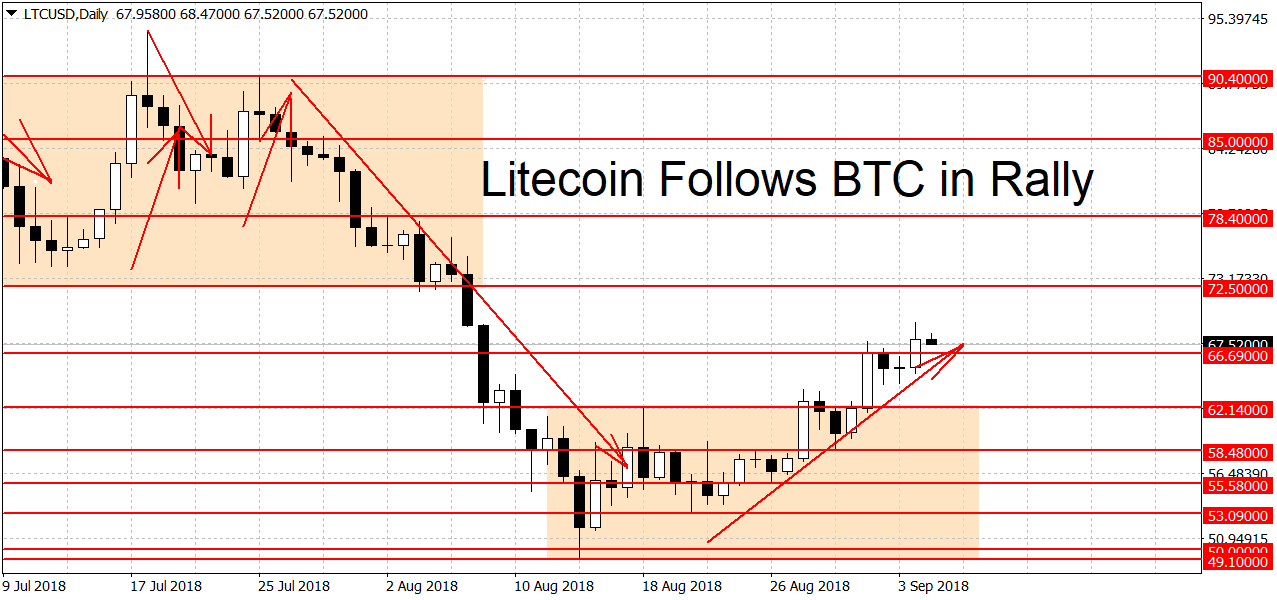
A break below $55.58 dollars is needed to end the current bullish run. A move below $53.09 dollars could start another bear run. Further down we have more support at the $50 round figure and the recent swing low at $49.10 dollars. The 2013 high at $48.40 dollars is another notable price level. That high wasn’t broken until July of 2017. Due to the cluster of strong support levels at $50, $49.10 and $48.40, conservative bears may wait and see if this area is cleared before jumping in.
Higher up we have resistance at $72.50 followed by $79.57 and $90.40 dollars. The in-between round levels of $80 and $90 could also act as temporary resistance. The top of the last mini-bull trend at $94.34 is an important resistance. A breakout above here could lead to a quick test of the $100 round figure. On the longer-term charts the picture is unchanged, we’re bearish on the weeklies but slightly bullish on the monthlies.
Trade cryptocurrencies with FXOpen broker.
FXOpen offers the world's most popular cryptocurrency CFDs*, including Bitcoin and Ethereum. Floating spreads, 1:2 leverage — at your service (additional fees may apply). Open your trading account now or learn more about crypto CFD trading with FXOpen.
*Important: At FXOpen UK, Cryptocurrency trading via CFDs is only available to our Professional clients. They are not available for trading by Retail clients. To find out more information about how this may affect you, please get in touch with our team.
This article represents the opinion of the Companies operating under the FXOpen brand only. It is not to be construed as an offer, solicitation, or recommendation with respect to products and services provided by the Companies operating under the FXOpen brand, nor is it to be considered financial advice.
Stay ahead of the market!
Subscribe now to our mailing list and receive the latest market news and insights delivered directly to your inbox.


Latest articles

Apple: Earnings Day Above the Activity Zone
On 30 April, after the market close, Apple Inc. will release its financial results for the second quarter of fiscal 2026. The consensus forecast, based on estimates from 31 analysts, points to revenue of around $109.7 billion, with expected

USD/JPY and USD/CHF Near Key Levels: The Dollar Supported by the Fed
The US dollar continues to trend upwards following the Federal Reserve meeting, drawing support from the regulator’s moderately hawkish stance and comments by Jerome Powell. Markets interpret the Fed’s rhetoric as a signal that restrictive policy is likely

EUR/USD and GBP/USD consolidate ahead of the Fed decision
European currencies are showing subdued dynamics, entering a consolidation phase following their previous advance. Earlier, EUR/USD and GBP/USD broke out of their ranges and strengthened; however, the subsequent correction has led both pairs to retest the previously breached