


Bitcoin, Litecoin Float Over Yearly Lows
FXOpen
Both bitcoin and litecoin are trading only a few percentage points above the 2018 lows. Bitcoin is quoted at $6,075 dollars right now, down by $625 dollars or 9.3 percent. Litecoin is trading at $77.31 dollars, down by $20 and almost 21% in percentage terms.
Bitcoin Floats Above 2018 Lows
Bitcoin hit a new yearly low of $5,766 on Sunday but we got a fairly quick rebound from here. In the next few days the dead-cat bounce took us to $6,326 dollars but as you can see on the chart below a lot of those gains have since faded.
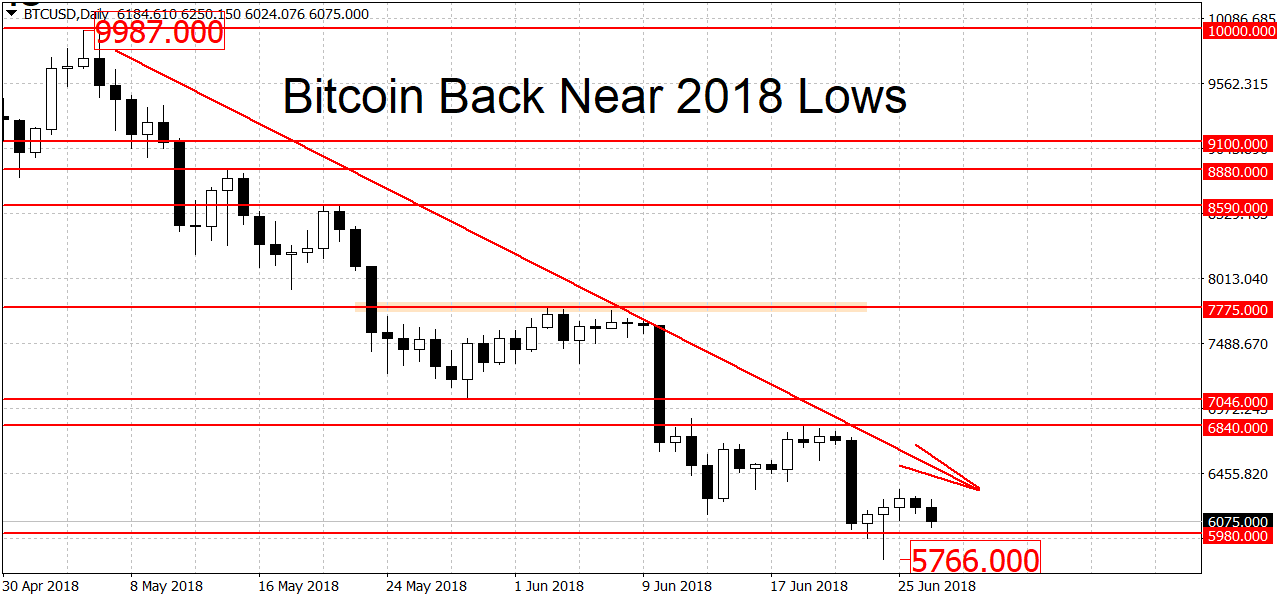
We are still in a downtrend on the daily charts. To end it we need a breakout above $6,840 dollars per coin. A new rally, however, requires a break of the $7,775 resistance as well. Higher up there’s more resistance at $8,590 and 8,880 dollars per coin. The $10,000 round figure is another notable resistance level.
On the lower end, there’s weak support around the new 2018 low at $5,766 dollars. A much stronger level is the $5,000 round figure. Besides being a major round level, $5,000 was also a former swing high that stalled the 2017 bubble by one month. It’s unlikely that this support level will be decisively broken on the first try. When and if $5,000 breaks, however, the losses could intensify.
On the longer-term charts, the picture is mixed. The weekly charts have now moved in a downtrend. The monthlies are keeping the bullish bias.
Litecoin Down by 21 Percent
Litecoin had a dramatic drop since last Tuesday. The altcoin is down by $20 to $77.31 dollars, a decline of close to 21 percent.
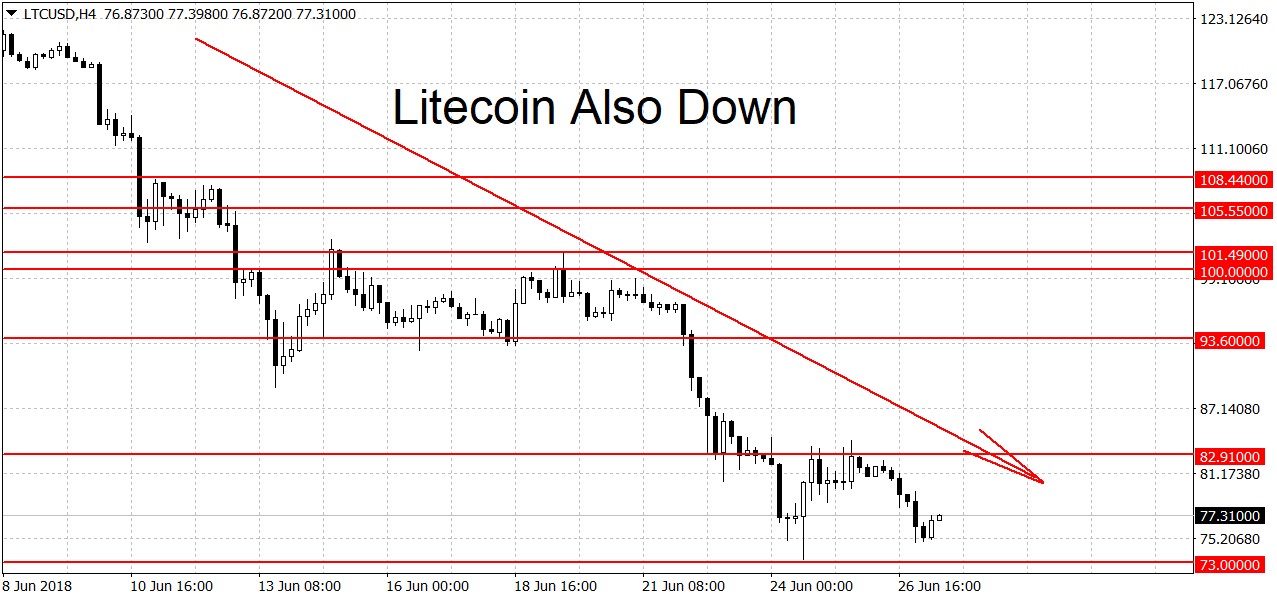
Similarly to BTC/USD, here too we are in a downtrend. To end it a breakout above the $101.49 swing high is needed. A move beyond $124 dollars could start a new rally in prices. Resistance higher up can be found at $128.80 dollars, followed by the round figures of $140 and $150 dollars. Higher still we have the $152.80 swing high as another notable resistance.
On the lower end, there’s some support stretching from $70 to $73 dollars. The latter figure is the 2018 low for LTC/USD. Below this area of support, the next major level is around $50 dollars. Here we have the 2013 high at $48.40 dollars coupled with the $50 round figure. On the longer-term charts, litecoin is bearish on the weeklies but bullish on the monthly charts.
Try cryptocurrency trading with the Forex Bitcoin broker FXOpen.
FXOpen offers the world's most popular cryptocurrency CFDs*, including Bitcoin and Ethereum. Floating spreads, 1:2 leverage — at your service (additional fees may apply). Open your trading account now or learn more about crypto CFD trading with FXOpen.
*Important: At FXOpen UK, Cryptocurrency trading via CFDs is only available to our Professional clients. They are not available for trading by Retail clients. To find out more information about how this may affect you, please get in touch with our team.
This article represents the opinion of the Companies operating under the FXOpen brand only. It is not to be construed as an offer, solicitation, or recommendation with respect to products and services provided by the Companies operating under the FXOpen brand, nor is it to be considered financial advice.
Stay ahead of the market!
Subscribe now to our mailing list and receive the latest market news and insights delivered directly to your inbox.


Latest articles

EUR/USD Eyes Gains As USD/CHF Weakness Deepens Again
EUR/USD started a fresh increase above 1.1700 and 1.1720. USD/CHF declined further and is now struggling below 0.7835.
Important Takeaways for EUR/USD and USD/CHF Analysis Today
· The Euro started a decent increase from

Apple: Earnings Day Above the Activity Zone
On 30 April, after the market close, Apple Inc. will release its financial results for the second quarter of fiscal 2026. The consensus forecast, based on estimates from 31 analysts, points to revenue of around $109.7 billion, with expected

USD/JPY and USD/CHF Near Key Levels: The Dollar Supported by the Fed
The US dollar continues to trend upwards following the Federal Reserve meeting, drawing support from the regulator’s moderately hawkish stance and comments by Jerome Powell. Markets interpret the Fed’s rhetoric as a signal that restrictive policy is likely