


Bitcoin, Litecoin Gain Some Ground
FXOpen
Both Bitcoin and Litecoin are trading higher this week. Big brother BTC is trading up by $16 dollars or 2.1 percent. Its little brother Litecoin is quoted at $3.59 right now, 3.5 percent higher compared to last Tuesday.
Bitcoin Higher by 2.1 Percent
Like we said above, Bitcoin is up by 2.1 percent during the past seven days. The bulls managed to clear the $745 hurdle and head higher again. Yesterday prices hit a new yearly high of $774.99 on FXOpen/BTC-E. From here we drifted somewhat lower and we’re currently trading at $767 dollars.
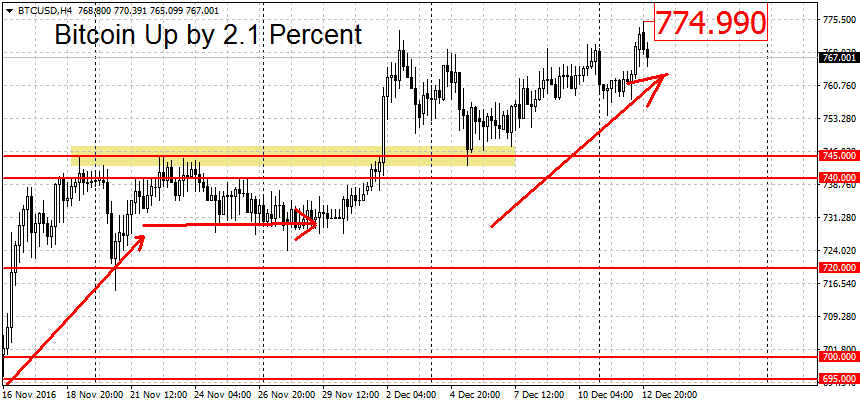
The uptrend is still in place for BTC/USD. To end it the bears will have to make a decisive break below the previous resistance now turned support at $745 dollars per coin. A move below $740 will be needed to achieve this. The $723 swing low is the new threshold for starting a downtrend. A clean break below here could shift the trend from up to down. Lower still we find potential support at $715, closely followed by the $700 round figure.
It’s harder to pinpoint notable resistance levels to the upside because, like we said above, we’re trading near multi-year highs. Yesterday’s high near $775 is weak resistance, followed by stronger levels at the $800 and $850 round figures. All three trends for bitcoin (short-term, medium-term and long-term) remain bullish.
Litecoin Retraces From Crash Lows
Litecoin retraces from the crash lows hit last week. We’re now quoted at $3.59, higher by 12 cents or 3.5 percent compared to last Tuesday. Measuring from last week’s low the total recovery is 23 cents or 6.8 percent.
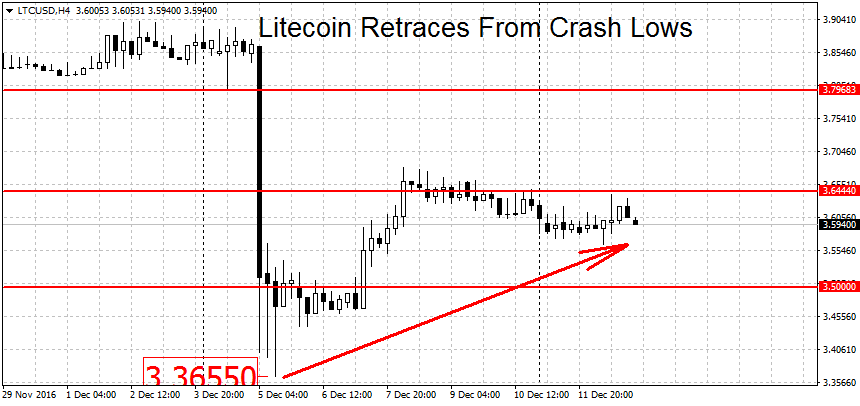
However, despite these gains, LTC/USD is still in a downtrend on the short-term charts. To end it the bears will have to continue the up-move beyond $3.90. A break above $3.95 would shift the trend to the upside. Notable resistance above here can be found at the $4 round figure, $4.08 and $4.15 dollars. While the short-term trend for LTC is down, both the medium-term and long-term trends are still undecided.
On the other end, we have the crash lows at $3.36 dollars as potential support. This level is followed by the $3.22 swing low, an eight-month low for LTC. Lower still we have more support at the $3 round figure and the $2.89 swing low. We end the levels to the downside with the 2015 August lows near $2.50 dollars per coin.
FXOpen offers the world's most popular cryptocurrency CFDs*, including Bitcoin and Ethereum. Floating spreads, 1:2 leverage — at your service (additional fees may apply). Open your trading account now or learn more about crypto CFD trading with FXOpen.
*Important: At FXOpen UK, Cryptocurrency trading via CFDs is only available to our Professional clients. They are not available for trading by Retail clients. To find out more information about how this may affect you, please get in touch with our team.
This article represents the opinion of the Companies operating under the FXOpen brand only. It is not to be construed as an offer, solicitation, or recommendation with respect to products and services provided by the Companies operating under the FXOpen brand, nor is it to be considered financial advice.
Stay ahead of the market!
Subscribe now to our mailing list and receive the latest market news and insights delivered directly to your inbox.


Latest articles

EUR/USD Eyes Gains As USD/CHF Weakness Deepens Again
EUR/USD started a fresh increase above 1.1700 and 1.1720. USD/CHF declined further and is now struggling below 0.7835.
Important Takeaways for EUR/USD and USD/CHF Analysis Today
· The Euro started a decent increase from

Apple: Earnings Day Above the Activity Zone
On 30 April, after the market close, Apple Inc. will release its financial results for the second quarter of fiscal 2026. The consensus forecast, based on estimates from 31 analysts, points to revenue of around $109.7 billion, with expected

USD/JPY and USD/CHF Near Key Levels: The Dollar Supported by the Fed
The US dollar continues to trend upwards following the Federal Reserve meeting, drawing support from the regulator’s moderately hawkish stance and comments by Jerome Powell. Markets interpret the Fed’s rhetoric as a signal that restrictive policy is likely