


Bitcoin, Litecoin Together in Range
FXOpen
Both Bitcoin and Litecoin stayed range-bound since our last update. One BTC is selling for $327.24 at the moment while LTC/USD is quoted at $3.12 dollars per coin. Let’s start with big brother bitcoin first.
Bitcoin Range-bound after Rally
Bitcoin is trading range-bound after the end of its rally last Thursday. This shouldn’t come as a surprise to our readers. Back then we wrote that with the end of the bitcoin uptrend, the crypto-market is now trading in limbo.
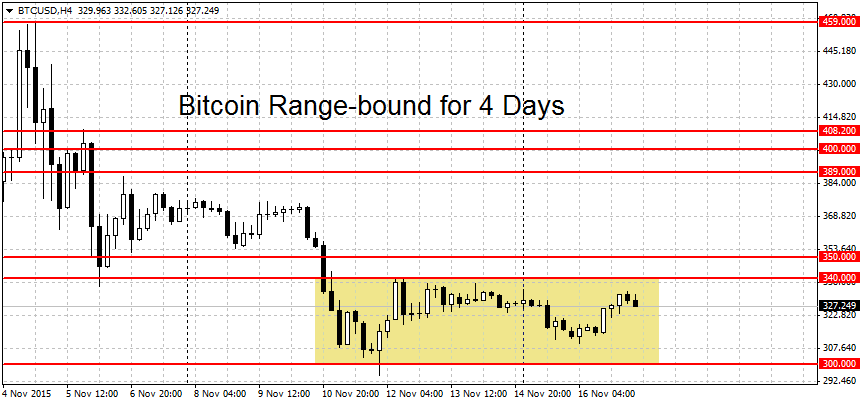
On the 4-hour chart above we can see that BTC/USD stayed range-bound for 4 days now. The consolidation area is marked with a yellow rectangle. Prices are locked in roughly between $300 and $340 dollars but these should not be considered as breakout bounds. The threshold to re-starting the rally stands much higher at $500 dollars per coin. This was the high reached on November 4th on most USD bitcoin exchanges. Below $500 some resistance can be found in the $340-$350 area, followed by another large resistance area between $390 and $410 dollars per coin.
On the bottom, some support can be found between $295 and the $300 round figure. The $295 swing low is the lowest low this month. A decisive break below $285 dollars will technically start a new BTC downtrend. However, due the recent end of the rally, caution is advised. Markets rarely switch from bullish to bearish without a prolonged consolidation period in between. Four days of range is not enough to give us comfortable breathing room. More time is likely needed for the rally to fade from people’s minds. This is barring any external news shocks of course.
Litecoin Consolidates for 1 Week
Unlike bitcoin, Litecoin has been range-bound for one week now. In our last LTC update, we called the end of the rally. Back then LTC/USD was trading at $3.29 dollars per coin. We are currently quoted at $3.12 dollars, 5 percent lower.
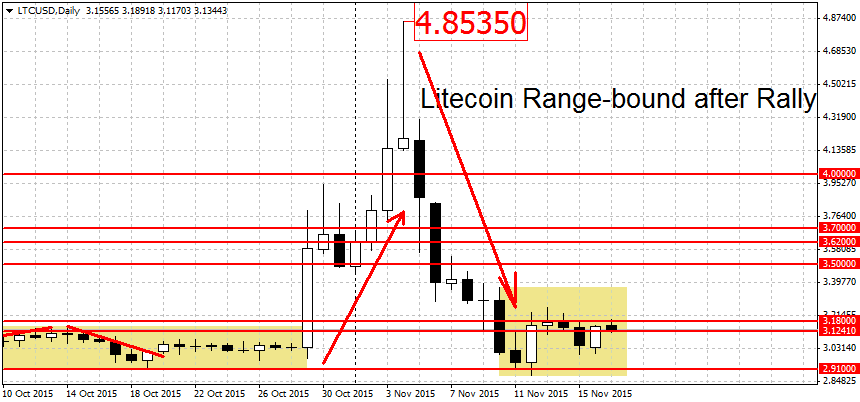
During the past seven days Litecoin briefly dipped below the $2.90 breakout bound. But the lows were quickly bought and soon after LTC/USD rallied to $3.26, only to fall back in the following two days. In our last LTC article we cautioned about this possibility: ”due to the recent rally, caution is advised on the short side. Markets rarely switch from bull to bear on a dime, without some consolidation in between.”
This false break demonstrates why you have to be very careful in the aftermath of large rallies. The possibility for false breaks on the downside is heightened as there are still market participants willing to ”buy coins on the cheap.”
The two breakout bounds for LTC are now at $4.85 and $2.88 dollars per coin. A decisive break beyond either of these price extremes may start a new uptrend/downtrend.
FXOpen offers the world's most popular cryptocurrency CFDs*, including Bitcoin and Ethereum. Floating spreads, 1:2 leverage — at your service (additional fees may apply). Open your trading account now or learn more about crypto CFD trading with FXOpen.
*Important: At FXOpen UK, Cryptocurrency trading via CFDs is only available to our Professional clients. They are not available for trading by Retail clients. To find out more information about how this may affect you, please get in touch with our team.
This article represents the opinion of the Companies operating under the FXOpen brand only. It is not to be construed as an offer, solicitation, or recommendation with respect to products and services provided by the Companies operating under the FXOpen brand, nor is it to be considered financial advice.
Stay ahead of the market!
Subscribe now to our mailing list and receive the latest market news and insights delivered directly to your inbox.


Latest articles

DAX 40: consolidation amid technology sell-off
A wave of selling in the technology sector that emerged earlier this week has weighed on European equities. The trigger was investor concern over the profitability of large-scale debt-funded investments by major US tech companies in AI infrastructure. The Nasdaq

Euro Hits Fresh Yearly Lows Amid Dovish ECB Signals
The euro remains under pressure following weak macroeconomic data from the euro area and fresh signals that the European Central Bank is prepared to maintain a more accommodative monetary policy stance. Data released yesterday pointed to a deterioration in business

Pound at Key Levels: Markets Assess Impact of Political Uncertainty in the UK
The British pound remains under pressure following increased political uncertainty in the United Kingdom triggered by the Prime Minister’s resignation. Investors are assessing potential shifts in the political and economic policy outlook after the head of government stepped down,