


Bitcoin Nears Psychological $10,000 Mark
FXOpen
Both bitcoin and litecoin continued their rallies this week. Bitcoin got close to hitting the psychological $10,000 mark today and LTC/USD broke to new all-time highs.
Bitcoin Nears $10,000 Mark
Bitcoin prices hit a high of $9,960 dollars today, narrowly missing the psychological $10,000 level. We are currently quoted just slightly off the highs at $9,921 dollars per coin.
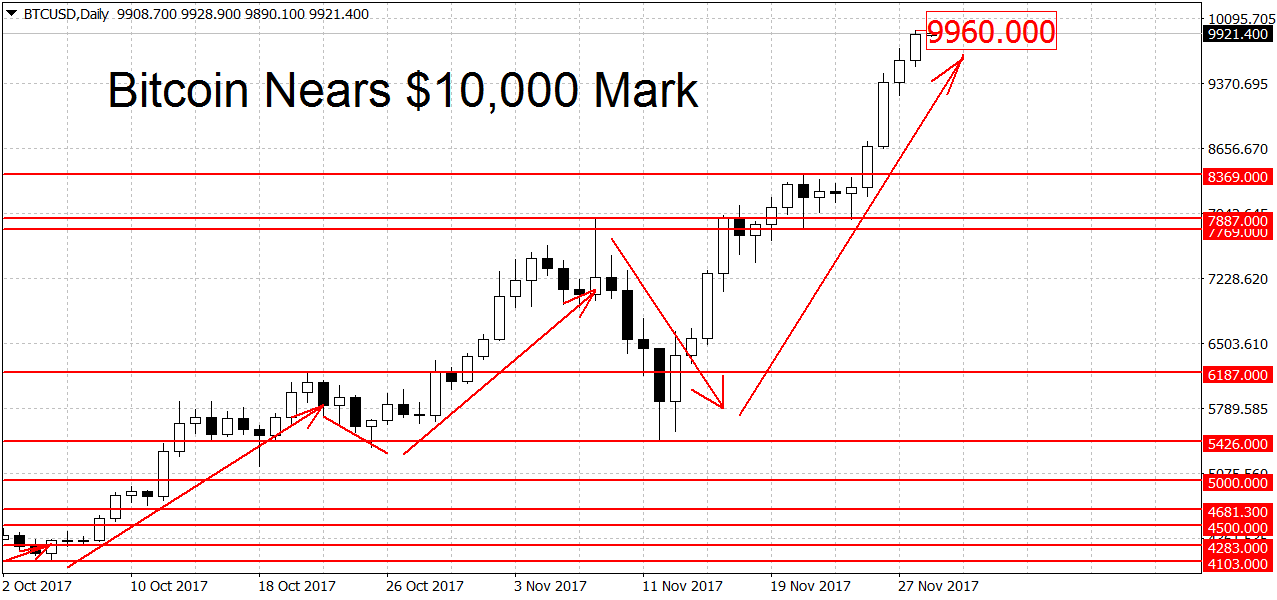
Naturally the rally is still in place, to end it the bears will have to push BTC/USD below the $7,769 swing low. Support above here can be found at the $7,887 and $8,369 swing highs. Somewhat weaker support levels are the round figures at $8,000 and $9,000 dollars per coin. A new downtrend requires a breakdown below the $5,426 swing low. Further down we have strong support at the $5,000 round figure.
Given that we’re at close to all-time highs there are no previous resistance levels to note above current prices. It’s hard to say where prices may stop/pause if the $10,000 level is decisively broken. Other round figures like $10,500, $11,000 etc may act as resistance, at least temporarily. On the longer-term charts (both weekly and monthly) bitcoin still looks bullish.
Litecoin at New All-time High
Litecoin prices hit a new all-time high of $94.47 dollars, surpassing the previous high at $93.60 dollars. We are currently trading a bit below here at $93.55 dollars per coin.
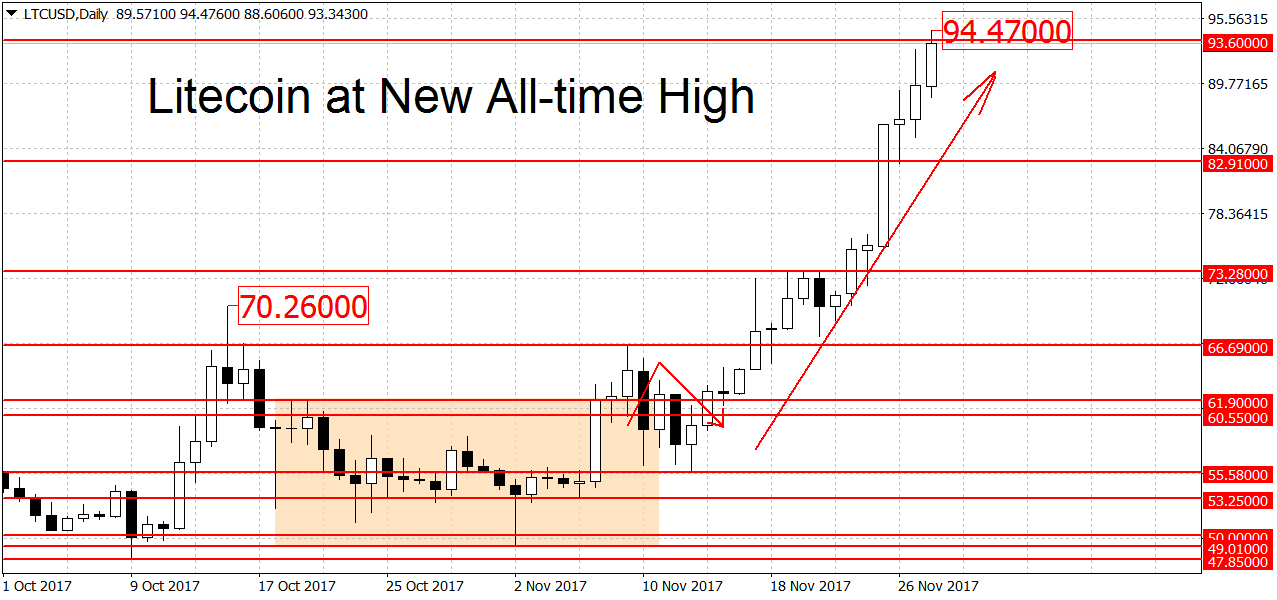
Similarly to bitcoin, LTC/USD remains in an uptrend. In order to end it we need to see a clearing of the area around the $66.69 level. Here we have the former swing high at $66.69 and the swing low at $67.51 dollars. A decisive breakdown below here could open the door to the the next support area around $60 dollars. A new downtrend needs a break of the $55.58 swing low.
On the upside we are currently in a potential resistance area. The 87 cents move above $93.60 doesn’t quit ‘clear’ this former resistance. We need to see a deeper and more decisive breakout here. If that occurs the next resistance to watch out for is the $100 round figure. Like the $10,000 mark in bitcoin, this is a psychological level that may be used for profit taking by some market participants. On the longer-term charts litecoin is now in rally mode on both the weekly and the monthly charts.
FXOpen offers the world's most popular cryptocurrency CFDs*, including Bitcoin and Ethereum. Floating spreads, 1:2 leverage — at your service (additional fees may apply). Open your trading account now or learn more about crypto CFD trading with FXOpen.
*Important: At FXOpen UK, Cryptocurrency trading via CFDs is only available to our Professional clients. They are not available for trading by Retail clients. To find out more information about how this may affect you, please get in touch with our team.
This article represents the opinion of the Companies operating under the FXOpen brand only. It is not to be construed as an offer, solicitation, or recommendation with respect to products and services provided by the Companies operating under the FXOpen brand, nor is it to be considered financial advice.
Stay ahead of the market!
Subscribe now to our mailing list and receive the latest market news and insights delivered directly to your inbox.


Latest articles

EUR/USD Eyes Gains As USD/CHF Weakness Deepens Again
EUR/USD started a fresh increase above 1.1700 and 1.1720. USD/CHF declined further and is now struggling below 0.7835.
Important Takeaways for EUR/USD and USD/CHF Analysis Today
· The Euro started a decent increase from

Apple: Earnings Day Above the Activity Zone
On 30 April, after the market close, Apple Inc. will release its financial results for the second quarter of fiscal 2026. The consensus forecast, based on estimates from 31 analysts, points to revenue of around $109.7 billion, with expected

USD/JPY and USD/CHF Near Key Levels: The Dollar Supported by the Fed
The US dollar continues to trend upwards following the Federal Reserve meeting, drawing support from the regulator’s moderately hawkish stance and comments by Jerome Powell. Markets interpret the Fed’s rhetoric as a signal that restrictive policy is likely