


Bitcoin off Highs, Litecoin Down
FXOpen
Bitcoin is trading at $7770 right now, $716 dollars off the $8,486 high reached last week. Today’s losses are taking down other crypto-currencies as well, with Litecoin down around 5 percent.
Bitcoin Off Highs
Bitcoin traders took a while to digest the news about the ETF rejection but it appears that it’s finally starting to happen. As noted in our previous article this rejection is problematic because a large part of the rally was build on speculation about a possible ETF approval in August. But with the rejection reasons dealing with the bitcoin market itself and not a particular trading vehicle, that ETF now seems dead in the water too.
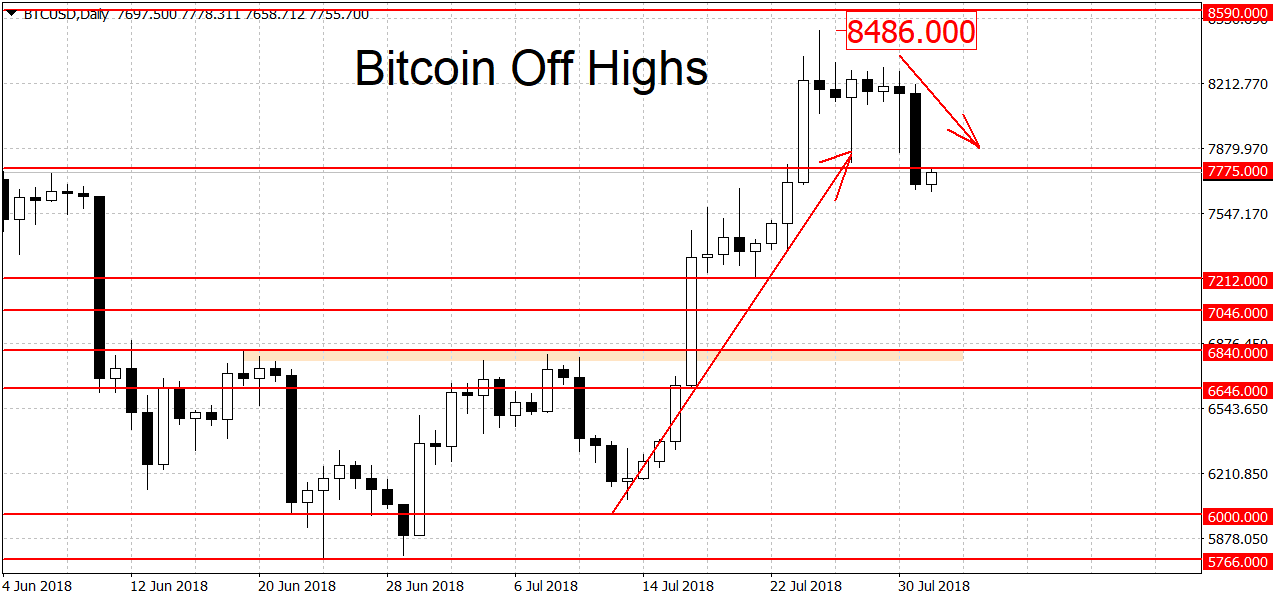
Technically BTC/USD is still in a bull market on the daily charts. To end it we need a breakdown below the $7,212 dollars swing low. A move below the $6,000 round figure is needed to trigger a new downtrend in prices.
In between these two levels there’s strong support in the $6,800 – $6,900 area. This was the breakout point for the current rally and this is also where we find several previous swing highs such as $6,840, $6,788, $6,821 and $6,806 dollars. Because resistance becomes support this area should at least slow down any decline. On the weekly charts bitcoin is in a downtrend. The monthly charts are still looking bullish.
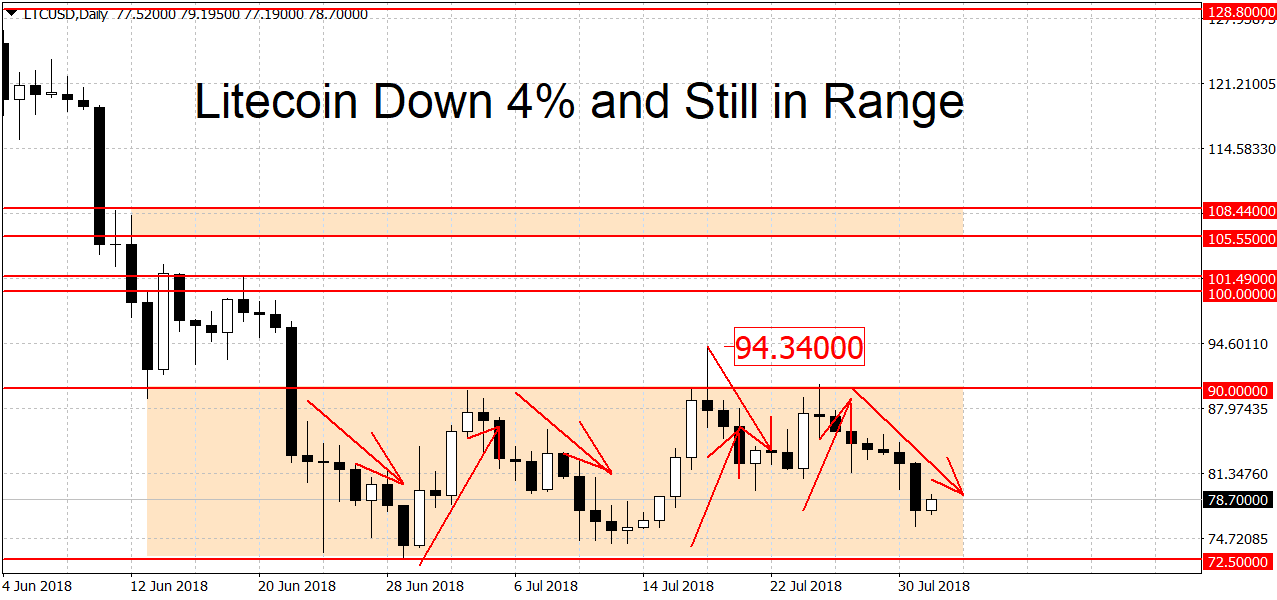
Litecoin Down 5 Percent
Litecoin is down by 5 percent today, from $82 to $78 dollars per coin. As you can see on the chart below, LTC/USD is still inside the same range it’s been in for the past few weeks. Two times the bulls tried to unsuccessfully break out, the first time trading as high as $94.34 dollars. This was heavily sold into and by the end of that day LTC was back below the top of the range, closing at $87.81. The second try took us only to $90.40 before sellers reemerged.
Part of the reason why altcoins have been so weak in the face of a 49 percent rally in BTC prices was the fact that the bitcoin rally was ETF-based, as noted above. In the hypothetical situation of ETF approval it’s likely that specs money would’ve flown from alts to bitcoin in attempt to front run a possible rise in prices. While BTC rallied by 49 percent, Litecoin only rose by 30%, when measured from bottom to top.
The breakout points for LTC/USD are now at $94.34 and $72.50 dollars. A decisive move beyond either of these two price extremes could start a new trend. On the longer-term charts Litecoin is in the same boat as BTC, bearish on the weeklies but bullish on the monthlies.
Try LTC trading on FXOpen demo account.
FXOpen offers the world's most popular cryptocurrency CFDs*, including Bitcoin and Ethereum. Floating spreads, 1:2 leverage — at your service (additional fees may apply). Open your trading account now or learn more about crypto CFD trading with FXOpen.
*Important: At FXOpen UK, Cryptocurrency trading via CFDs is only available to our Professional clients. They are not available for trading by Retail clients. To find out more information about how this may affect you, please get in touch with our team.
This article represents the opinion of the Companies operating under the FXOpen brand only. It is not to be construed as an offer, solicitation, or recommendation with respect to products and services provided by the Companies operating under the FXOpen brand, nor is it to be considered financial advice.
Stay ahead of the market!
Subscribe now to our mailing list and receive the latest market news and insights delivered directly to your inbox.


Latest articles

Apple: Earnings Day Above the Activity Zone
On 30 April, after the market close, Apple Inc. will release its financial results for the second quarter of fiscal 2026. The consensus forecast, based on estimates from 31 analysts, points to revenue of around $109.7 billion, with expected

USD/JPY and USD/CHF Near Key Levels: The Dollar Supported by the Fed
The US dollar continues to trend upwards following the Federal Reserve meeting, drawing support from the regulator’s moderately hawkish stance and comments by Jerome Powell. Markets interpret the Fed’s rhetoric as a signal that restrictive policy is likely

EUR/USD and GBP/USD consolidate ahead of the Fed decision
European currencies are showing subdued dynamics, entering a consolidation phase following their previous advance. Earlier, EUR/USD and GBP/USD broke out of their ranges and strengthened; however, the subsequent correction has led both pairs to retest the previously breached