


Bitcoin U-Turns on Trump Victory
FXOpen
The crypto-market had a interesting week, like most financial markets. The US election last Tuesday sparked a wave of volatility that was also felt in Bitcoin and Litecoin. But the initial impact was soon negated as prices took a U-turn and erased the gains.
Bitcoin U-Turns on Trump Victory
The US election brought a surprising winner last Tuesday. Despite what the polls were suggesting, Donald Trump will be the new US president. This surprise result initially led to a shock risk-off mode in markets. We saw the Yen rallying, the SP500 crashing by 5% and Gold and Bitcoin moving higher. Prices hit a high of $729 dollars on November 9th right after the election results.
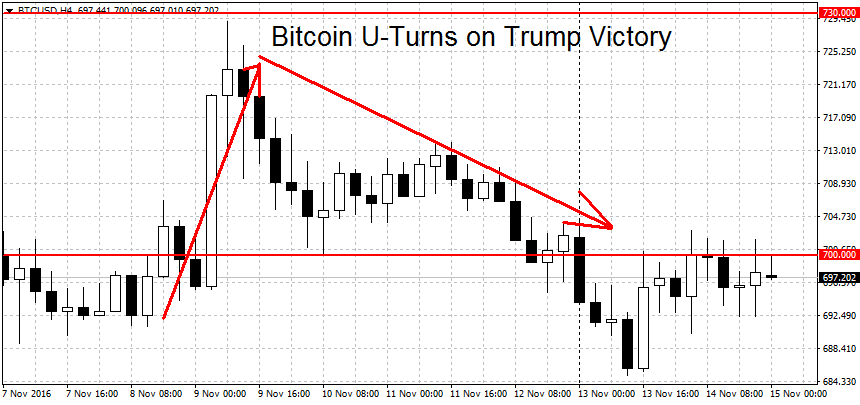
However that move quickly reversed course and few days later BTC prices were trading back to where they started. This is the scenario we outlined in our previous article, a short-term positive effect that would be quickly faded. The move lower didn’t stop here. As we can see on the chart above, during the dump last week a low of $685.07 was hit.
This week we’re seeing a slight recovery with prices trading at $697 dollars at the moment. Because the important $670 support level wasn’t broken the trend higher remains in place. We’re now looking bit higher at the $680 level as a potential trend stopper. A new downtrend requires a break below the former swing high at $657 dollars.
On the upper end, the double top near $730 dollars will be crucial. A breakout above here could intensify the gains. For bitcoin all three trends (short-term, medium-term and long-term) are still bullish.
Litecoin Breakdown Rejected
Litecoin followed a similar pattern after Trump’s victory. Prices on Fxopen rose by 15 cents to $3.88, a high that was quickly faded here as well. But unlike bitcoin, the LTC selling was so strong that prices briefly entered a bear market. A low of $3.64 was hit on November 13th. From here however a surge of buying commenced and Litecoin rallied 25 cents or almost 7 percent in the span of 2 hours.
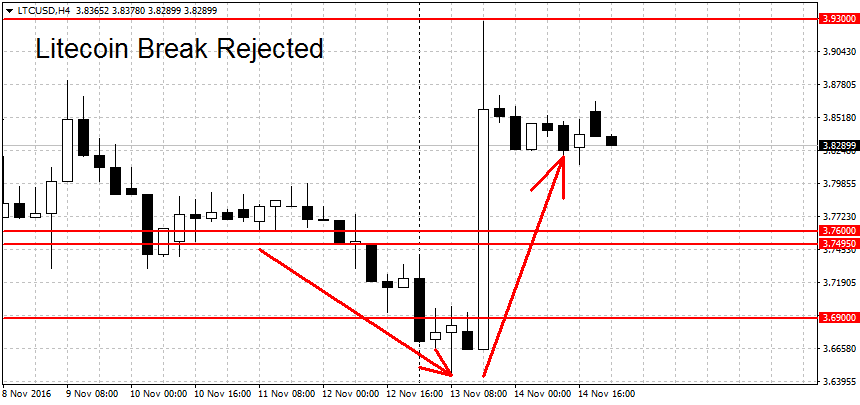
The speed and the strength of this rally suggests that the move lower was a false break. We’re now back into uncharted territory for LTC/USD. A new uptrend requires a breakout above the $4.08 swing high while a new downtrend should break the November lows at $3.64 dollars. More support below here can be found at the $3.50 round figure followed by the $3.22 swing low.
FXOpen offers the world's most popular cryptocurrency CFDs*, including Bitcoin and Ethereum. Floating spreads, 1:2 leverage — at your service (additional fees may apply). Open your trading account now or learn more about crypto CFD trading with FXOpen.
*Important: At FXOpen UK, Cryptocurrency trading via CFDs is only available to our Professional clients. They are not available for trading by Retail clients. To find out more information about how this may affect you, please get in touch with our team.
This article represents the opinion of the Companies operating under the FXOpen brand only. It is not to be construed as an offer, solicitation, or recommendation with respect to products and services provided by the Companies operating under the FXOpen brand, nor is it to be considered financial advice.
Stay ahead of the market!
Subscribe now to our mailing list and receive the latest market news and insights delivered directly to your inbox.


Latest articles

Weekly Market Insights with Gary Thomson: The Week of Central Banks and Earnings
In this video, we’ll explore the key economic events and market trends, shaping the financial landscape. Get ready for insights into financial markets to help you navigate the week ahead. Let’s dive in!
In this episode of Market

Intel at a Crossroads: Earnings Beat Meets Technical Resistance
Intel has just delivered its strongest quarter in over fifteen years, and the market reaction says it all. Q2 2026 revenue surged 25% year-over-year to $16.1 billion, crushing the consensus estimate of $14.42 billion, while adjusted EPS of

Tesla: Complex Range Structure Breaks Down Following Quarterly Earnings
Tesla released its Q2 2026 results after the market closed on 22 July. Revenue increased 26% year-on-year to $28.24 billion, while vehicle deliveries reached a record 480,126 units. However, operating margin fell sharply to 1.4%, down from