


FXOpen

Bitcoin is being pulled around by Ether troubles again. During the past few days we’re seeing BTC/USD zig-zag up and down depending on what ETH does. Meanwhile Bitcoin’s little brother Litecoin continues the slow trend downward.
Bitcoin Pulled Around by Ether
Bitcoin is being pulled up/down by Ether. The strong inverse relationship between these two coins is back in full force. Every major Ether sell-off leads to some BTC gains while every large ETH rally drops Bitcoin prices somewhat. You can read more on why ETH volatility is off the charts HERE.
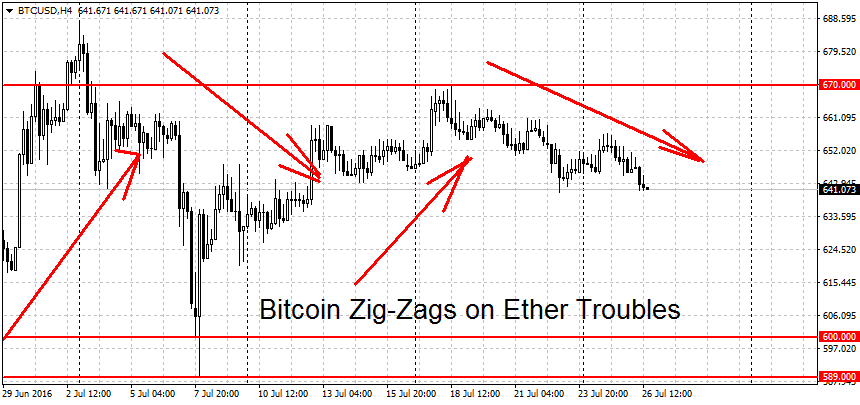
To break this deadlock, we will need to see Ether volatility decrease or Bitcoin break out. The two potentially critical points are $670 on the upside and $589 on the downside. On other BTC exchanges, these levels correspond to around $690 at the top end and $610 on the bottom. As we’ve written previously, prices can fluctuate substantially on different Bitcoin exchanges, so it’s always a good idea to check where the general market is trading.
Resistance levels above $670/$690 can be found at the $700 round figure followed by the $744 swing high and the $800 round figure. On the lower end below $589 we have a support at $540-$550 on FXOpen followed by another round figure at $500. The breakout point for the latest major rally at $460 per coin is a major level of support as well. The longer-run trends (weekly and monthly) remain bullish for Bitcoin.
Litecoin Losses Continue
Alternative cryptocurrency Litecoin is still clocking losses. The coin is currently trading at $3.89, down by 18 cents or 4.4 percent since last Tuesday. Prices traded as high as $4.12 during the past seven days but this was not enough to clear the important resistance at $4.16 per coin. This level is still the key figure to watch on the upside. A breakout above here would end the current downtrend.
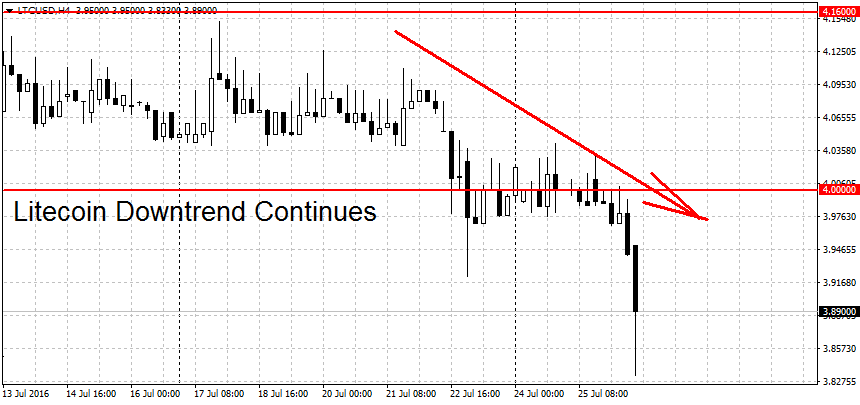
A new uptrend requires a break of $4.40 as well. Resistance levels beyond here are at $4.50-$4.52 per coin followed by the November spike high of $4.85 and the round figures at $5 and $5.50. This year’s high at $5.86 is another potential resistance.
On the lower end, support can be found at $3.78 followed by a support area from $3.50 to $3.61. A clearing of this area could lead to more losses toward $3.30 per coin. The weekly trend for LTC/USD is up while the monthly trend is still neutral.
FXOpen offers the world's most popular cryptocurrency CFDs*, including Bitcoin and Ethereum. Floating spreads, 1:2 leverage — at your service. Open your trading account now or learn more about crypto CFD trading with FXOpen.
*At FXOpen UK and FXOpen AU, Cryptocurrency CFDs are only available for trading by those clients categorised as Professional clients under FCA Rules and Professional clients under ASIC Rules respectively. They are not available for trading by Retail clients.
This article represents the opinion of the Companies operating under the FXOpen brand only. It is not to be construed as an offer, solicitation, or recommendation with respect to products and services provided by the Companies operating under the FXOpen brand, nor is it to be considered financial advice.
Stay ahead of the market!
Subscribe now to our mailing list and receive the latest market news and insights delivered directly to your inbox.

Latest articles

Weekly Market Wrap With Gary Thomson: Nasdaq, EUR/USD, USD/CHF, Brent Crude Oil, Googl Shares
Get the latest scoop on the week's hottest headlines, all in one convenient video. Join Gary Thomson, the COO of FXOpen UK, as he breaks down the most significant news reports and shares his expert insights.
- Nasdaq Composite: Worst Session

Analysis of AUD/USD: Exchange Rate Falls to Early May Low
As indicated by the 4-hour AUD/USD chart today:
→ the rate fell below 0.652, a level last seen on May 2;
→ the RSI indicator dropped below 15, a level last seen during the panic over the spread of COVID-19

Analysis of AMZN Stock: Price at 1.5-Month Low
As shown in the AMZN chart, the stock price dropped below:
→ the psychological level of $180;
→ the mid-June interim low.
The last time AMZN traded below $180 was in early June.
Thus, AMZN has faced sell-offs, similar to other tech