


Bitcoin Pushing on Support, LTC Below $1.66
FXOpen
After ending the rally with a trendline break, bitcoin has switched its attention to the downside. A push lower on March 25th carved out a low at $235. From here we rallied a bit to $252 per coin but soon the sellers came back in force, pushing the pair down again. We hit a low $234.08 this time around. The market continues to be undecided however as the lows were short-lived. We are currently quoted at $241.06.
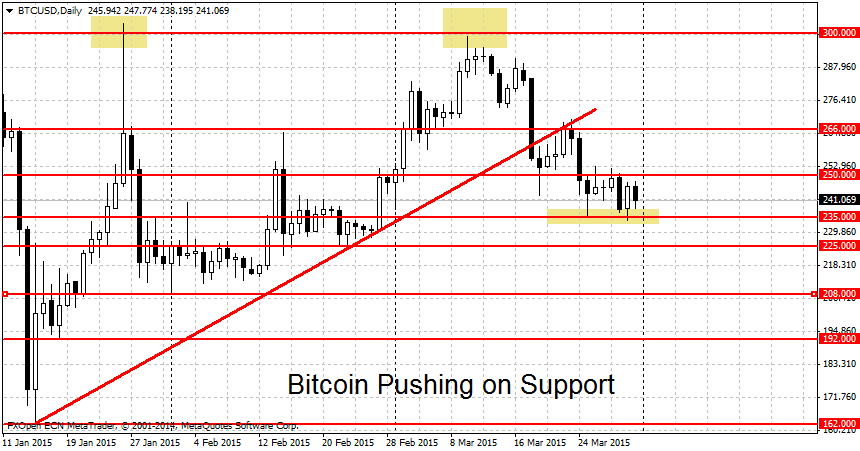
The brief move below $235 doesn’t met the criteria for a break. Prices only stayed below the mark for 30 minutes yesterday. Plus the dip lower didn’t gain traction with BTC/USD bottoming out at $234.08. Thus this level remains to be a valid support level. A decisive break below here could open the way for more losses toward $225. However, given the proximity to the current support at $235, if we breakdown lower, I don’t think that this figure will present a challenge to the bears. A better level to watch out for is the support area between the $200 round figure and the $208 swing low.
On the upside, BTC will need to breakout above the $300 mark to gain traction. A rally above could lead to gains toward the December 23rd swing high at $334. Higher up, resistance levels can be found at $350 and $380.
Litecoin Below $1.66
Alternative cryptocurrency Litecoin is trading below $1.66. This is the lower bound of its range. Litecoin was stuck trading in this congestion area for almost two months. But despite the move lower, LTC/USD is still having trouble breaking free from the figure. We are currently quoted at 1.63 flat , just 1.8 percent below the $1.66 support.
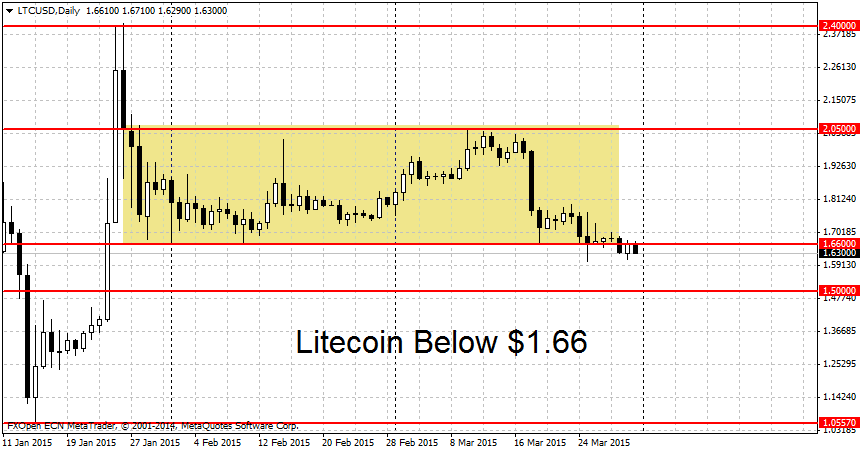
While more losses are likely going forward, the lack of follow-through is concerning. A more conservative approach would be to wait for a break of the new swing low at $1.60 per coin. If LTC manages to break free from $1.66 by pushing below $1.60, we may see a sustained downtrend emerge. Since Litecoin tends to follow bitcoin’s moves, a BTC/USD break below $234 may lead to more LTC losses. Support levels on the downside include $1.50 and $1.25.
On the higher end, Litecoin will need to rally all the way to $2.05 per coin to break the high of its range. A bitcoin rally above $300 may also lead to a rally in LTC prices, although this wasn’t the case during the previous BTC move higher. Lately altcoins had lackluster performance on the upside and have only followed bitcoin to the downside.
FXOpen offers the world's most popular cryptocurrency CFDs*, including Bitcoin and Ethereum. Floating spreads, 1:2 leverage — at your service (additional fees may apply). Open your trading account now or learn more about crypto CFD trading with FXOpen.
*Important: At FXOpen UK, Cryptocurrency trading via CFDs is only available to our Professional clients. They are not available for trading by Retail clients. To find out more information about how this may affect you, please get in touch with our team.
This article represents the opinion of the Companies operating under the FXOpen brand only. It is not to be construed as an offer, solicitation, or recommendation with respect to products and services provided by the Companies operating under the FXOpen brand, nor is it to be considered financial advice.
Stay ahead of the market!
Subscribe now to our mailing list and receive the latest market news and insights delivered directly to your inbox.


Latest articles

EUR/USD Eyes Gains As USD/CHF Weakness Deepens Again
EUR/USD started a fresh increase above 1.1700 and 1.1720. USD/CHF declined further and is now struggling below 0.7835.
Important Takeaways for EUR/USD and USD/CHF Analysis Today
· The Euro started a decent increase from

Apple: Earnings Day Above the Activity Zone
On 30 April, after the market close, Apple Inc. will release its financial results for the second quarter of fiscal 2026. The consensus forecast, based on estimates from 31 analysts, points to revenue of around $109.7 billion, with expected

USD/JPY and USD/CHF Near Key Levels: The Dollar Supported by the Fed
The US dollar continues to trend upwards following the Federal Reserve meeting, drawing support from the regulator’s moderately hawkish stance and comments by Jerome Powell. Markets interpret the Fed’s rhetoric as a signal that restrictive policy is likely