


Bitcoin Rallies Above $1,700, Litecoin Hits $29.75
FXOpen
The crypto bubble continues for another week. Yesterday bitcoin hit a high of $1,705 dollars on Fxopen. It’s little brother Litecoin narrowly missed hitting the $30 dollars level.
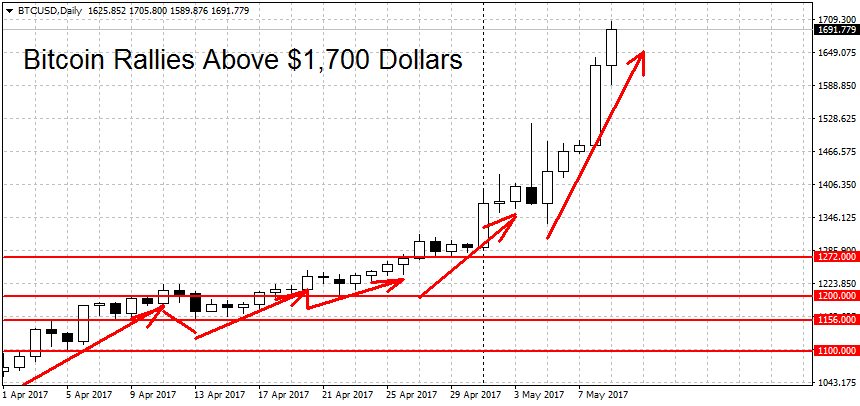
Bitcoin Rallies Above $1,700 Dollars
The bitcoin rally goes on. Prices hit a high of $1,705.80 dollars yesterday. We are currently quoted only slightly below this high water mark at $1,691 dollars.
Fundamentally we can ‘pin’ this latest surge on three reasons. The first and most obvious one is the ongoing bubble in crypto markets. Forex Bitcoin prices have risen almost 100% since hitting a low of $901 on March 25th. Its market cap is now flirting with the 30 billion figure while the total crypto market cap is approaching 50 billion.
The second reason is troubled exchange Bitfinex announcing an audit. While the company didn’t choose one of the four major accounting firms, traders took the announcement as a sign of solvency. Spreads between Bitfinex and the rest of the USD market narrowed significantly, adding to the positive market sentiment.
The third and final reason for BTC gains is the bloodbath in the altcoin market. Ether, Bitcoin’s largest competitor, fell by over 25 percent in the past two days before recovering somewhat. Most of the top ten altcoins are trading deep in the red today.
There is little doubt that prices are now in bubble territory across all cryptos. But bubbles can last a long time and provide even more profits if you’re already long. A break of the current bullish trend requires a move below the $1,272 swing low. A move below the $1,200 round figure would switch the current rally to a downtrend. If you’re not already in a position, taking one near the potential highs seems risky. Volatility is already high and any trades should be done with very small size to account for this.
Litecoin Almost Hits $30 Dollars
Litecoin narrowly missed the $30 round figure on Fxopen, trading as high as $29.75 yesterday. Today, however, the coin is under severe selling pressure due to the ongoing bleeding in the altcoin market. A low of $23.49 was hit few hours ago, a drop of over 20 percent from the highs.
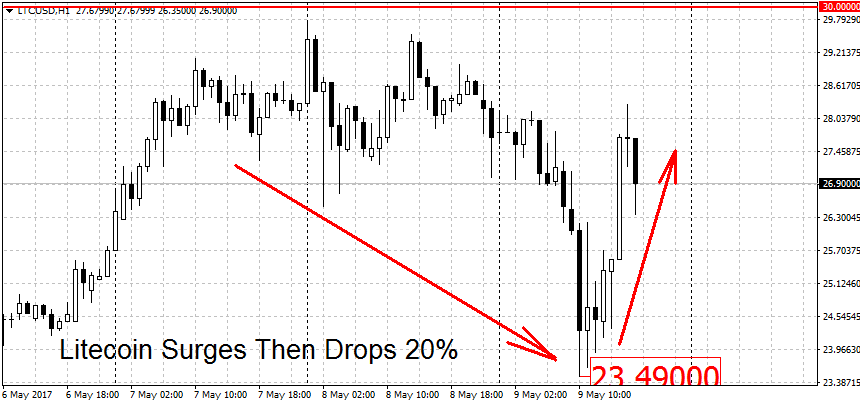
Nonetheless, the bullish trend is still in place and to end it the bears will have to push LTC/USD below the $14 dollars swing low. A decisive break below the $10 round figure could switch the current trend from up to down. On the long-term charts (both weekly and monthly) LTC is still in a bullish trend.
FXOpen offers the world's most popular cryptocurrency CFDs*, including Bitcoin and Ethereum. Floating spreads, 1:2 leverage — at your service (additional fees may apply). Open your trading account now or learn more about crypto CFD trading with FXOpen.
*Important: At FXOpen UK, Cryptocurrency trading via CFDs is only available to our Professional clients. They are not available for trading by Retail clients. To find out more information about how this may affect you, please get in touch with our team.
This article represents the opinion of the Companies operating under the FXOpen brand only. It is not to be construed as an offer, solicitation, or recommendation with respect to products and services provided by the Companies operating under the FXOpen brand, nor is it to be considered financial advice.
Stay ahead of the market!
Subscribe now to our mailing list and receive the latest market news and insights delivered directly to your inbox.


Latest articles

Ripple: Letter to Congress Stirs the Crypto Market
At the beginning of June, more than 200 crypto companies and industry groups — including Coinbase, Andreessen Horowitz and Ripple Labs — sent a letter to Senate Majority and Minority Leaders John Thune and Chuck Schumer, urging them to bring the Digital

GBP/JPY: Ascending Triangle Under Pressure
The GBP/JPY pair has come under pressure after the Bank of Japan raised its policy rate to 1.0% on 16 June. The Bank of England is following the opposite path: at its 30 April meeting, the Monetary Policy
Pound Under Pressure: Markets Await Bank of England And SNB Decisions
The British pound remains under pressure following weaker-than-expected inflation data, which has reinforced expectations of further monetary easing by the Bank of England. Investors are staying cautious ahead of today’s policy meetings of both the UK central bank and