


Bitcoin Rallies as Altcoins Falter
FXOpen

Bitcoin continues the slow but unrelenting rally. We’re currently quoted at $1,190 dollars per coin, up from $1,147 last week. Litecoin prices are up too, albeit with much higher volatility.
Bitcoin Enters Bull Market
Bitcoin has technically entered a bull market again on the daily charts. We’re trading at $1,190 right now, up by 3.8 percent since last week.
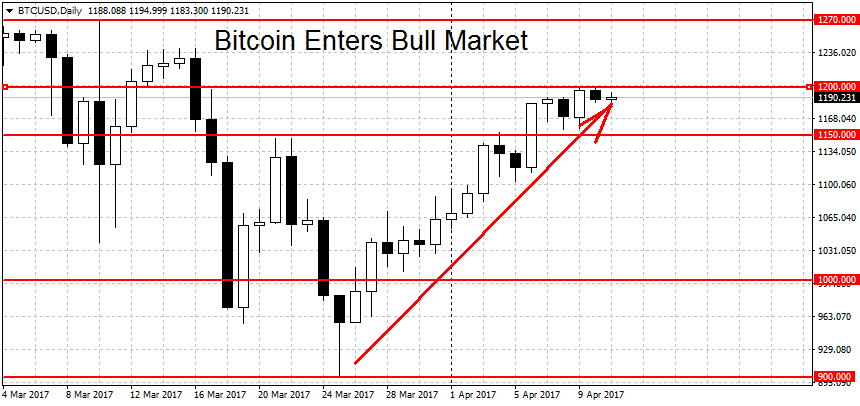
The gains have been slow but steady. Yesterday we topped out at $1,199.99 on bitcoin currency trading broker FXOpen, just narrowly below the $1,200 round figure. It seems that a lot of these gains are on the back of the deflating altcoin bubble. For example, the previous high flyers Ether and Dash are now struggling to find support.
The all-time high for BTC/USD on FXOpen was at $1,269 dollars. On other exchanges prices traded as high as $1,330 during the ETF speculation frenzy. Aside from these two numbers, the round figures at $1,200, $1,250 and $1,300 are potential resistance levels. To end the current rally the bears will have to push prices below the $1,050 level.
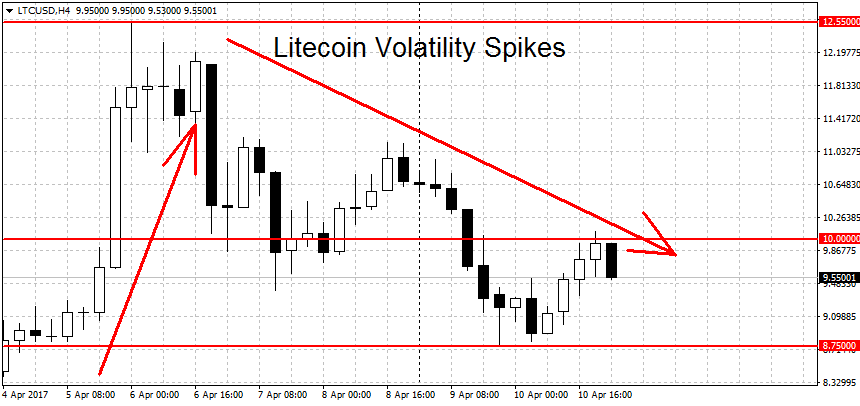
Litecoin Volatility Spikes
Litecoin volatility spiked during the previous seven days. Prices hit a high of $12.55 on April 6th as it seemed certain that segwit will reach the critical 75 percent threshold. That number quickly dropped down lower however and prices eased up a bit from the highs.
Then a series of tweets by Wang Chun from F2pool (largest LTC pool) implied that the pool may withdraw its segwit signaling. This caused a panicked market reaction during which a low of $9.39 was hit. The drama doesn’t end here, however.
After segwit signaling dropped to the 60% range, the LTC creator Charlie Lee send out this tweet, calling for the community to re-route around miners and activate segwit with UASF (User Activated Soft Fork). Without getting too technical, this is a somewhat risky proposal that could result in a chain split. In a recent tweet, Charlie alludes to this possibility. The UASF option hasn’t been used in bitcoin (yet) because it’s considered a ‘nuclear option’ that could pit the community and the miners against each other.
With LTC prices at only $9.55 right now from the lows around $8.75, it seems that speculators are positive but not ecstatic with the UASF turn of events. Segwit signaling is back to 70% but we’re not seeing the usual bullish market reaction. Technically the Litecoin rally will remain in place until the $6.50 support level is taken out.
FXOpen offers the world's most popular cryptocurrency CFDs*, including Bitcoin and Ethereum. Floating spreads, 1:2 leverage — at your service (additional fees may apply). Open your trading account now or learn more about crypto CFD trading with FXOpen.
*Important: At FXOpen UK, Cryptocurrency trading via CFDs is only available to our Professional clients. They are not available for trading by Retail clients. To find out more information about how this may affect you, please get in touch with our team.
This article represents the opinion of the Companies operating under the FXOpen brand only. It is not to be construed as an offer, solicitation, or recommendation with respect to products and services provided by the Companies operating under the FXOpen brand, nor is it to be considered financial advice.
Stay ahead of the market!
Subscribe now to our mailing list and receive the latest market news and insights delivered directly to your inbox.


Latest articles

US Dollar Index: A Defining Week for the King of the Markets
The dollar heads into a pivotal week trading near 101.80, just off a 15-month high, with the Fed's July 29 meeting standing as the clear focal point. Markets currently price roughly a 65% chance of a hold, though renewed

NZD/USD: Inflation Surge Meets Strong US Dollar Pressure
On 21 July, Stats NZ reported an acceleration in inflation: the Consumer Price Index rose 1.5% in the second quarter, while the annual inflation rate climbed to 4.1%, its highest level in more than two years and slightly

Weekly Market Insights with Gary Thomson: The Week of Central Banks and Earnings
In this video, we’ll explore the key economic events and market trends, shaping the financial landscape. Get ready for insights into financial markets to help you navigate the week ahead. Let’s dive in!
In this episode of Market