


Bitcoin Rallies as China Volume Plummets
FXOpen

Bitcoin prices rallied strongly today, entering a new short-term bull market. This is happening despite a plunge in volume on Chinese bitcoin exchanges. Litecoin prices are moving up as well, helped by the altcoin’s transition to Segwit.
Bitcoin Rallies as China Volumes Plummet
Bitcoin prices are trading at $934 dollars right now, up by 3.2 percent since Thursday. The rally happened despite (or because) plummeting trading volumes on Chinese bitcoin exchanges. After instituting trading fees last week, the Big Three lost over 90 percent of their volume. Most are now trading close to the volumes seen on the USD-based exchanges although still leading by a bit.
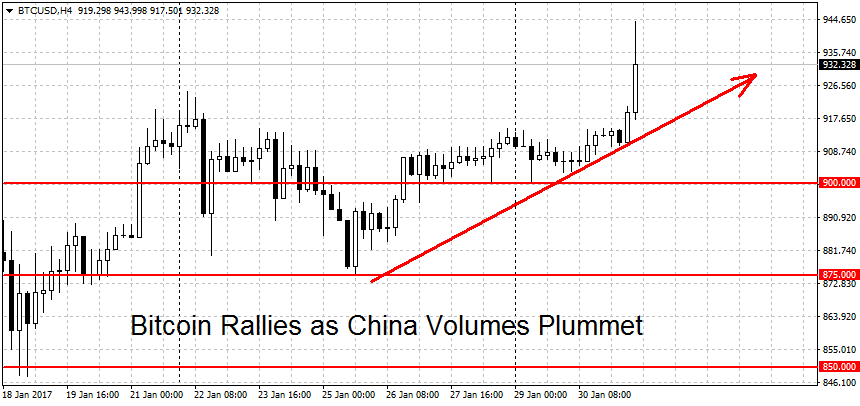
With the recent upmove, bitcoin prices are back in rally mode, at least on the daily charts. Resistance higher up can be found at the $950 and $1000 round figures, followed by the multi-year high at $1,096 on Fxopen and around $1,160 on other USD exchanges.
To end the current trend, the bears will have to push BTC back below the $875 swing low. A new downtrend still requires a break of the January lows at $748 dollars. Just below here we find a large support area between $730 and $750 dollars. A clean break of this area could intensify the move lower.
Fundamentally the picture still looks bleak, for many reasons stated in our previous BTC article. It’s possible that the reduction of volumes on Chinese sites helped to alleviate the swelling caused by increased government restrictions. If this is the case, the current uptrend could easily reverse as fundamentals come back into focus.
Litecoin Spikes on Segwit Progress
Litecoin initially spiked to a high of $4.12 today, only to reverse course and fall back down to $3.93 dollars. We are currently quoted closer to the lows of the day at $3.96 dollars per coin.
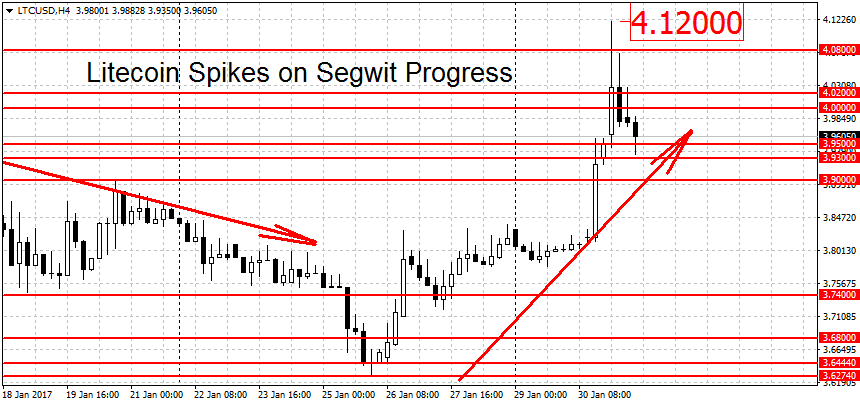
Much of the rise seems to be in relation to progress on Segwit adoption. While the bitcoin community remains locked in a debate on this issue, litecoiners moved forward. You can read more on what Segwit is here, along with the potential benefits.
While LTC/USD is not in rally mode yet, it’s very close to breaking out. A move above the $4.12 highs should push prices into a new short-term uptrend. On the lower end a new downtrend requires a break below $3.62 dollars. You can see more of the support/resistance levels on the chart above. For now we are still in ‘wait and see’ mode here.
FXOpen offers the world's most popular cryptocurrency CFDs*, including Bitcoin and Ethereum. Floating spreads, 1:2 leverage — at your service (additional fees may apply). Open your trading account now or learn more about crypto CFD trading with FXOpen.
*Important: At FXOpen UK, Cryptocurrency trading via CFDs is only available to our Professional clients. They are not available for trading by Retail clients. To find out more information about how this may affect you, please get in touch with our team.
This article represents the opinion of the Companies operating under the FXOpen brand only. It is not to be construed as an offer, solicitation, or recommendation with respect to products and services provided by the Companies operating under the FXOpen brand, nor is it to be considered financial advice.
Stay ahead of the market!
Subscribe now to our mailing list and receive the latest market news and insights delivered directly to your inbox.


Latest articles

US Dollar Strengthens Amid Equity Market Weakness and Hawkish Fed Rhetoric
The US dollar continues to hold firm near multi-year highs as sentiment across equity markets deteriorates and investors increasingly expect the Federal Reserve to maintain a restrictive monetary policy stance for longer. The US economy remains resilient, while inflation risks

Bitcoin: Corrective Channel Broken as Traders Turn More Active
Bitcoin has come under the influence of several factors simultaneously. The wave of selling at the beginning of June was linked to Strategy's first disclosed Bitcoin sale in several years, a prolonged series of outflows from spot ETFs, and a

DAX 40: consolidation amid technology sell-off
A wave of selling in the technology sector that emerged earlier this week has weighed on European equities. The trigger was investor concern over the profitability of large-scale debt-funded investments by major US tech companies in AI infrastructure. The Nasdaq