


FXOpen

Bitcoin prices are up close to 24 percent since our Tuesday update. Litecoin is up as well but only by $1.98 dollars or just under 5 percent.
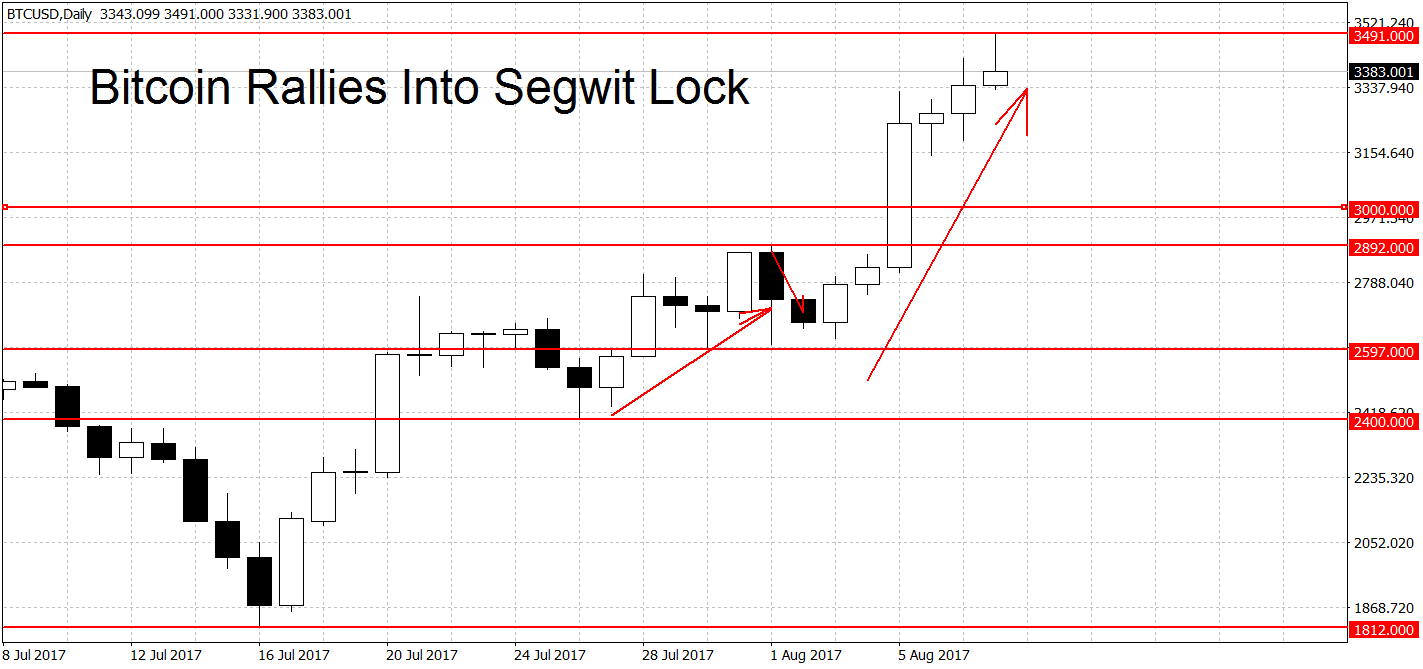
Bitcoin Rallies 24 Percent
Bitcoin prices rallied close to 24 percent in a week. The main driver for the gains seems to be the Segwit lock, expected to happen later today. Current projections set the lock at 25 blocks from now, around 17:46 GMT.
The ‘lock in’, just like the name says, is when Segwit gets locked in. Two weeks from this date the Segwit part of the Segwit2x upgrade becomes active. More on the technical details about Segwit2x HERE.
Today could produce some violent swings, similar to what we saw during the BIP91 activation a few weeks ago. It appears that some traders are already booking profits before the lock is final, fearing a similar decline. Looking at bitcoin from the daily charts however, allows us to avoid some of this noise.
We are currently trading near all-time highs at $3,383, down from $3,491 this morning. Support below here can be found at the round $3,000 figure, closely followed by the $2,892 swing high and the $2,597 swing low. A decisive break below here would end the current bullish trend. Further down we have more support at $2,400, $2,000 and $1,812 dollars per coin. A break below $2,200 would start a new BTC downtrend. On the long-term weekly and monthly charts, BTC/USD is in rally mode as well.
Litecoin Hits Resistance
Litecoin tried to follow big brother bitcoin higher but quickly hit a resistance level. Last week we hinted at $46.70 as a point where a new rally could begin. Unfortunately for the bulls, the break of this level was weak as we only hit a high of $47.22 before falling back.
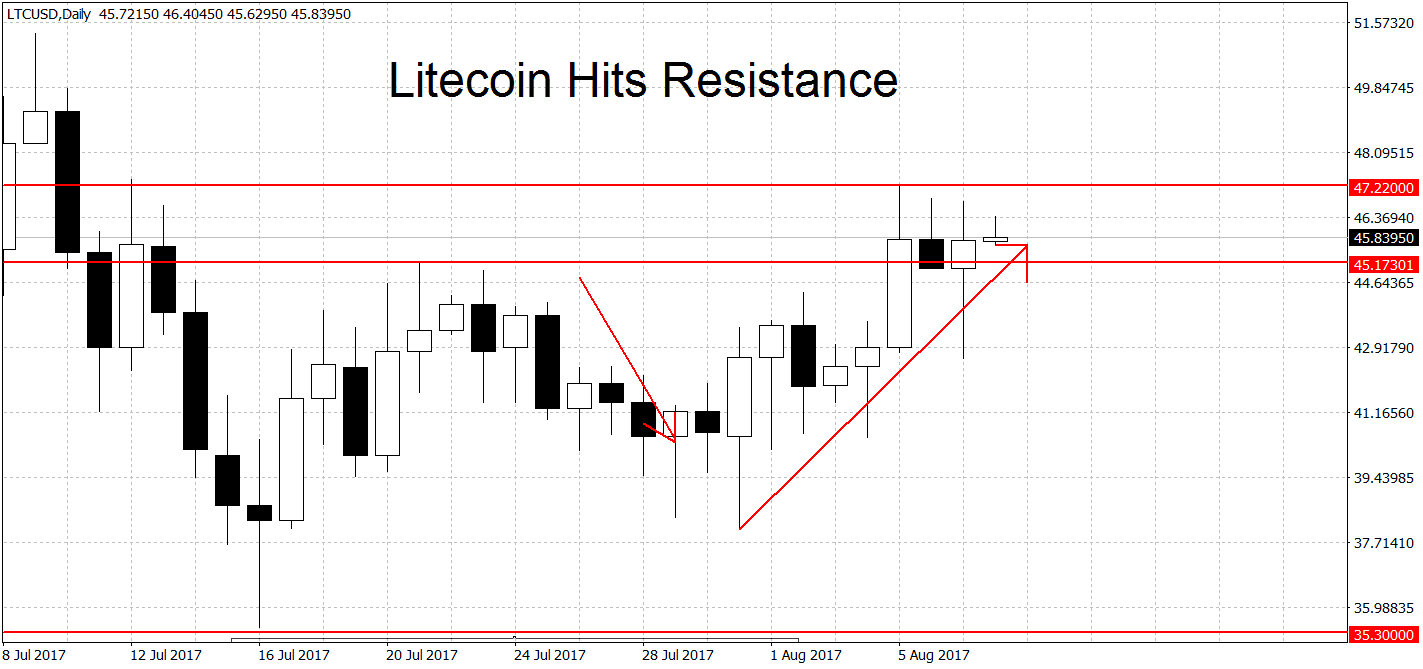
Now we’re looking for a break of the new high ($47.22) as a potential trend starter. As usual, we’re looking for a sustained move above this level, not just a brief and shallow spike. Resistance higher up can be found at the $50 round figure, followed by the $51.27 and $53.87 swing highs. A break of the $53.87 all-time high could extend the move higher.
On the lower end, the bears will need a break below the $38.11 swing low. A clean move below here could start a new downtrend in prices. Support below here can be found at the $35.45 swing low, closely followed by the $35 round figure and the $34.42 swing low. A move below this support area would clear the way for more LTC losses. Despite the muddled picture on the daily, on the longer-term charts, Litecoin is still looking bullish.
FXOpen offers the world's most popular cryptocurrency CFDs*, including Bitcoin and Ethereum. Floating spreads, 1:2 leverage — at your service. Open your trading account now or learn more about crypto CFD trading with FXOpen.
*At FXOpen UK and FXOpen AU, Cryptocurrency CFDs are only available for trading by those clients categorised as Professional clients under FCA Rules and Professional clients under ASIC Rules respectively. They are not available for trading by Retail clients.
This article represents the opinion of the Companies operating under the FXOpen brand only. It is not to be construed as an offer, solicitation, or recommendation with respect to products and services provided by the Companies operating under the FXOpen brand, nor is it to be considered financial advice.
Stay ahead of the market!
Subscribe now to our mailing list and receive the latest market news and insights delivered directly to your inbox.

Latest articles

Weekly Market Wrap With Gary Thomson: Nasdaq, EUR/USD, USD/CHF, Brent Crude Oil, Googl Shares
Get the latest scoop on the week's hottest headlines, all in one convenient video. Join Gary Thomson, the COO of FXOpen UK, as he breaks down the most significant news reports and shares his expert insights.
- Nasdaq Composite: Worst Session

Analysis of AUD/USD: Exchange Rate Falls to Early May Low
As indicated by the 4-hour AUD/USD chart today:
→ the rate fell below 0.652, a level last seen on May 2;
→ the RSI indicator dropped below 15, a level last seen during the panic over the spread of COVID-19

Analysis of AMZN Stock: Price at 1.5-Month Low
As shown in the AMZN chart, the stock price dropped below:
→ the psychological level of $180;
→ the mid-June interim low.
The last time AMZN traded below $180 was in early June.
Thus, AMZN has faced sell-offs, similar to other tech