


Bitcoin Rallies, Media Blames Grexit Fears
FXOpen
After a long range-bound period, BTC/USD finally rallied yesterday. Bitcoin gained $8 dollars and we peaked at $253.36.
Bitcoin Rallies but $250 Still in Play
Bitcoin is in full rally mode but the key $250 figure has yet to give way. Yesterday’s push stopped short at $253. We are currently trading right at the $250 mark. The strong momentum higher means that the figure will likely be broken soon but the conservative approach calls for waiting until we trade past $254/$255 dollars per coin.
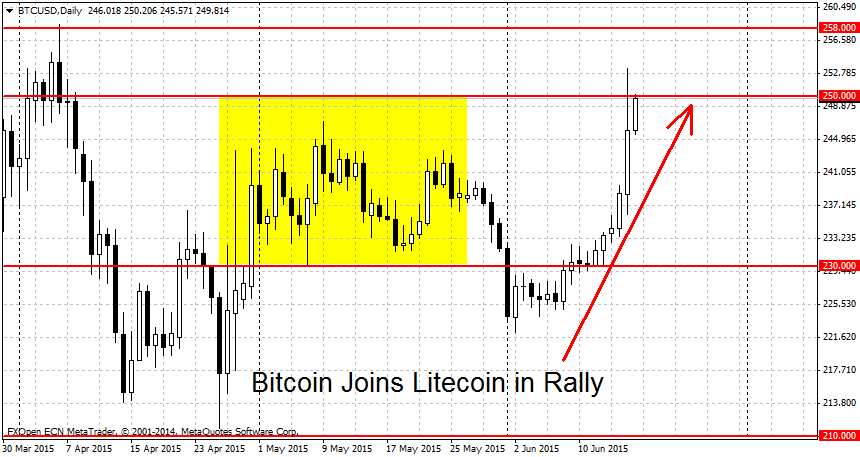
The first weak resistance higher can be found at $258, this was an April swing high for the crypto. But given the closeness to the current breakout point at $250-$255, if prices manage to head higher, it’s unlikely they will be stopped by $258. Higher up, the $270 mark is another important swing high. Further to the upside, the round $300 level is a key number to watch. This triple top stopped two previous BTC rallies. A surge past it would exacerbate the gains. On the lower end, a break below the $222 swing low would end the downtrend.
Caused by Grexit Worries?
The media are trying to tie in the breakdown in Greek negotiations with the bitcoin rally. Major media outlets like Reuters and Zerohedge have published articles in the same vein. The story goes that as the odds for a Greek default increase, ordinary citizens of that country will turn to bitcoin in order to avoid capital controls or protect savings. The articles allude that this is what happened back in 2013 when Cyprus instituted capital controls.
There are several problems with this thesis. The first one is that the breakdown in talks and potential default is not discounted in the regular capital markets. For example, the Greek 2 year note is currently trading at 29%, while this is high, it does not default level high. Furthermore, the Euro today closed down by only 0.3%, a far cry from panic mode.
This doesn’t mean that a Greek default won’t happen. Markets have mis-priced major events before. But to believe this theory would mean that the cryptocurrency markets are more efficient than the regular capital markets. This just isn’t the case, at least not at this stage. A more plausible scenario is that BTC prices are in the process of making a technical breakout after a long range-bound period.
FXOpen offers the world's most popular cryptocurrency CFDs*, including Bitcoin and Ethereum. Floating spreads, 1:2 leverage — at your service (additional fees may apply). Open your trading account now or learn more about crypto CFD trading with FXOpen.
*Important: At FXOpen UK, Cryptocurrency trading via CFDs is only available to our Professional clients. They are not available for trading by Retail clients. To find out more information about how this may affect you, please get in touch with our team.
This article represents the opinion of the Companies operating under the FXOpen brand only. It is not to be construed as an offer, solicitation, or recommendation with respect to products and services provided by the Companies operating under the FXOpen brand, nor is it to be considered financial advice.
Stay ahead of the market!
Subscribe now to our mailing list and receive the latest market news and insights delivered directly to your inbox.


Latest articles

Amazon Earnings: Does the Chart Already Know Something the Numbers Don't?
All eyes are on July 30, when Amazon reports Q2 2026 earnings, with Wall Street increasingly convinced the bar has been set too low. Consensus sees EPS near $1.82-$2.26 on roughly $197 billion in revenue, but the

WTI Analysis: Gap Breaks Short-Term Trend as Price Remains Trapped Between the POC and Profile Boundary
WTI crude oil plunged by more than 7% on 27 July 2026 after the US suspended a series of strikes against Iran over the weekend, raising hopes of a diplomatic solution and the reopening of shipping through the Strait of

US Dollar Index: A Defining Week for the King of the Markets
The dollar heads into a pivotal week trading near 101.80, just off a 15-month high, with the Fed's July 29 meeting standing as the clear focal point. Markets currently price roughly a 65% chance of a hold, though renewed