


FXOpen

Bitcoin prices rallied into another fork of the protocol and fell right after. Litecoin followed a similar pattern of first up, then down.
Bitcoin Rallies Into Another Fork
It’s a fork year for bitcoin! The door opened by bitcoin cash back in August is now in use again. The new (potential) fork is called bitcoin gold with the major change being a GPU-friendly mining algorithm. The supposed ‘snapshot’ happened early this morning on block 491,407. According to a help FAQ by Coinbase, the Bitcoin Gold team will pre-mine 100,000 Bitcoin Gold coins before releasing the software to the public. Unlike previous forks, the network will not be usable for several days until a working software is released.
While some of the major exchanges said that they will give the resulting coins from the new fork, they have not opened spot or futures markets for BTG. Due to these reasons, it seems unlikely that bitcoin gold will be a hit with the markets. It’s currently worth about 0.047 BTC on some smaller futures markets.
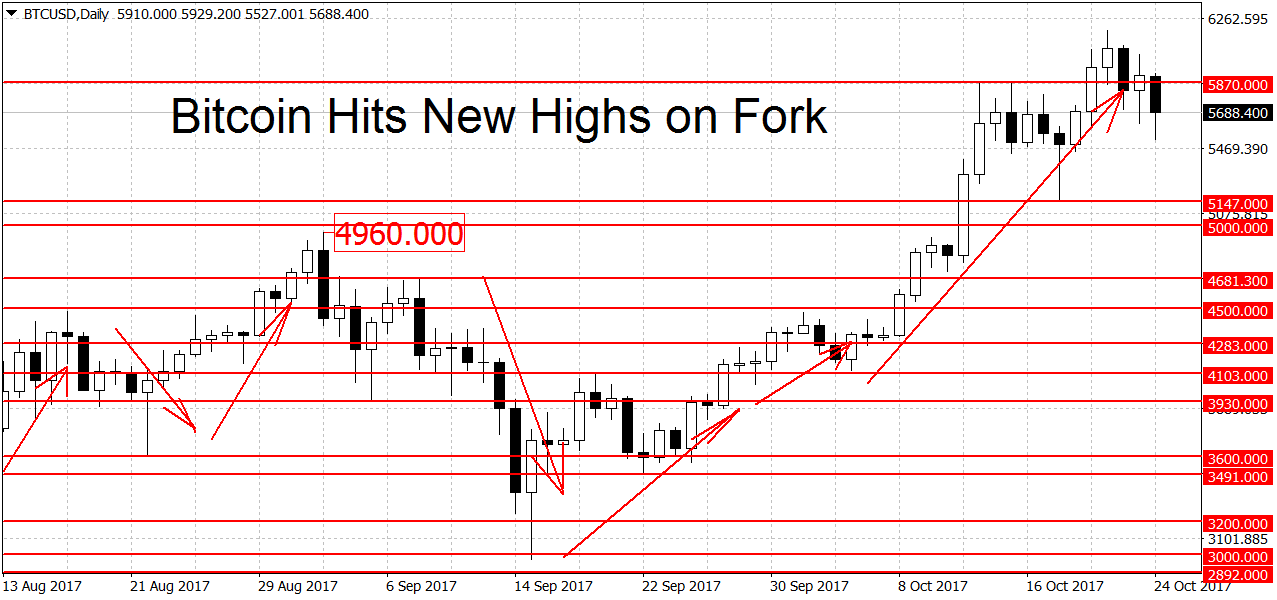
Back to regular bitcoin! Going into this fork we saw a rush of money into BTC. This led to another new all-time high on October 21st at $6,187 dollars per coin. Last night we saw prices rally from a low of $5,622 to a high of $5,997 after a popular bitcoin exchange announced that they will give out BTG. These moves got quickly reversed as the snapshot transpired and few hours later a low of $5,527 was hit.
Prices on FXOpen are quoted at $5,688 right now and we’re still in an uptrend. To end it, the bears will have to push BTC/USD below the $5,147 swing low. A move below another swing low of $4,123 is needed for a new downtrend. On the longer-term charts, BTC remains in rally mode.
Litecoin Follows Big Brother
To a smaller extent, LTC/USD followed the patterns seen in BTC/USD. However, litecoin was under pressure versus bitcoin because people converted to BTC to get the ‘free dividend’. This meant that LTC/USD topped out days before BTC/USD on October 15th. From here it was a slow slide down, interrupted by bitcoin-inspired rallies.
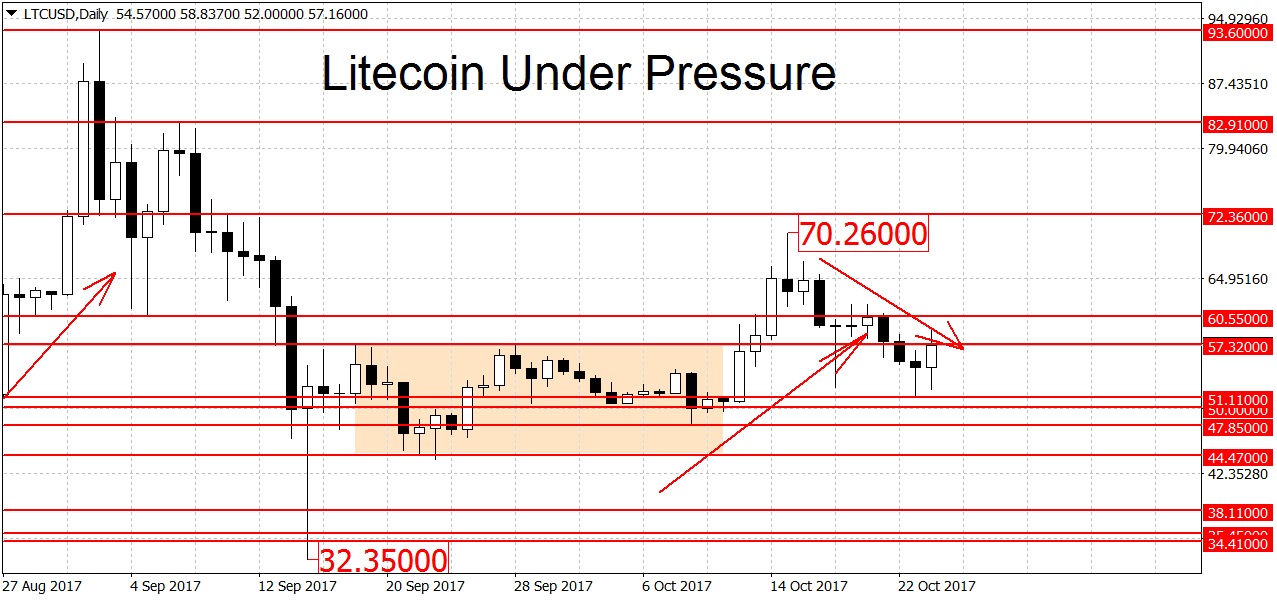
Now we are seeing a reversal of these money flows. As you can see on the chart above, today’s candle in LTC/USD is bullish versus the bearish candle in BTC/USD. We are currently trading at $57.30 dollars per coin. A break below the $51.11 swing low is needed to definitely end the current rally on the daily charts. On the weekly charts, LTC/USD is still range-bound but the monthly is in an uptrend.
Open an MT4 Bitcoin Crypto account with FXOpen broker.
FXOpen offers the world's most popular cryptocurrency CFDs*, including Bitcoin and Ethereum. Floating spreads, 1:2 leverage — at your service. Open your trading account now or learn more about crypto CFD trading with FXOpen.
*At FXOpen UK and FXOpen AU, Cryptocurrency CFDs are only available for trading by those clients categorised as Professional clients under FCA Rules and Professional clients under ASIC Rules respectively. They are not available for trading by Retail clients.
This article represents the opinion of the Companies operating under the FXOpen brand only. It is not to be construed as an offer, solicitation, or recommendation with respect to products and services provided by the Companies operating under the FXOpen brand, nor is it to be considered financial advice.
Stay ahead of the market!
Subscribe now to our mailing list and receive the latest market news and insights delivered directly to your inbox.

Latest articles

Weekly Market Wrap With Gary Thomson: Nasdaq, EUR/USD, USD/CHF, Brent Crude Oil, Googl Shares
Get the latest scoop on the week's hottest headlines, all in one convenient video. Join Gary Thomson, the COO of FXOpen UK, as he breaks down the most significant news reports and shares his expert insights.
- Nasdaq Composite: Worst Session

Analysis of AUD/USD: Exchange Rate Falls to Early May Low
As indicated by the 4-hour AUD/USD chart today:
→ the rate fell below 0.652, a level last seen on May 2;
→ the RSI indicator dropped below 15, a level last seen during the panic over the spread of COVID-19

Analysis of AMZN Stock: Price at 1.5-Month Low
As shown in the AMZN chart, the stock price dropped below:
→ the psychological level of $180;
→ the mid-June interim low.
The last time AMZN traded below $180 was in early June.
Thus, AMZN has faced sell-offs, similar to other tech