


FXOpen
Bitcoin slowly gained more ground since our last update. This supported the rest of the altcoin market. Litecoin rallied over 31 percent, Peercoin gained 21% and NMC added 11 cents or exactly 20%. But let’s start with big brother first.
Bitcoin Rally Continues
After a near brush with death at the $270 dollars support last week, the bitcoin rally continues. About 10 days ago prices on FxOpen briefly flash-crashed below this level. But the lows lasted less then 2 minutes as the cheap coins got bought up. Because the crash didn’t replicate on other platforms we said that: ‘
‘Still, the crash hasn’t altered the current bitcoin uptrend because other major exchanges stayed flat during this event. To end the current rally, the bears will need to make a decisive push below the important support at $265/$270 dollars. Due to low liquidity during the summer months, it’s better if the move lower is confirmed with other exchanges”
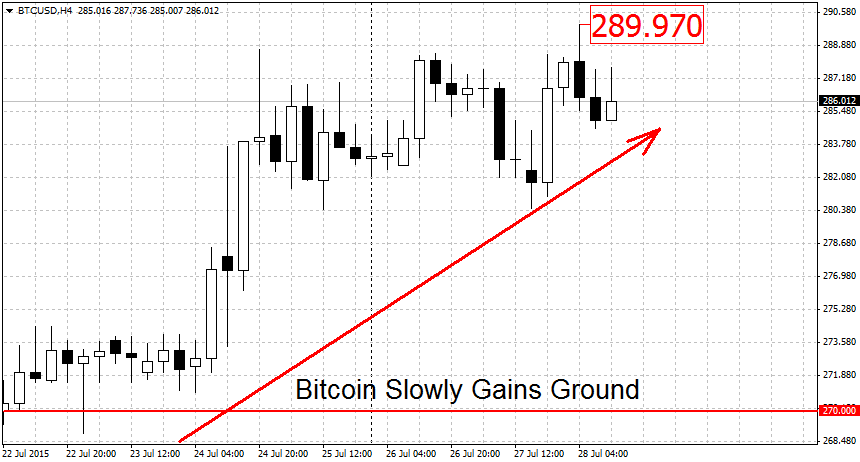
Since then BTC/USD rallied from $270 to a high of $289.97 today. This $20 dollar gain represents about 7.4 percent. We are currently quoted at $286.01, not far from the highs. Let’s take a look at some levels.
On the higher end, the round $300 number may act as resistance. But given that we already broke past this level in early July, any resistance will likely be weak. Higher up, we find a large resistance area from the July 12th high at $310.22 to the year’s high at $318.10. A clearing of this area should lead to more gains. On the lower end, a decisive break below the $265/$270 support would put an end to the rally.
Litecoin Moves Up by 31 Percent
Alternative cryptocurrency Litecoin moved up by 31 percent since the middle of last week. This is likely just a sympathy rally due to the gains seen in BTC/USD. It doesn’t alter the view that the LTC rally is over. To restart it, the bulls will need to push prices all the way to the July 10th highs at $8.64. We are currently quoted at $4.93 dollars per coin, right below the $5 round figure.
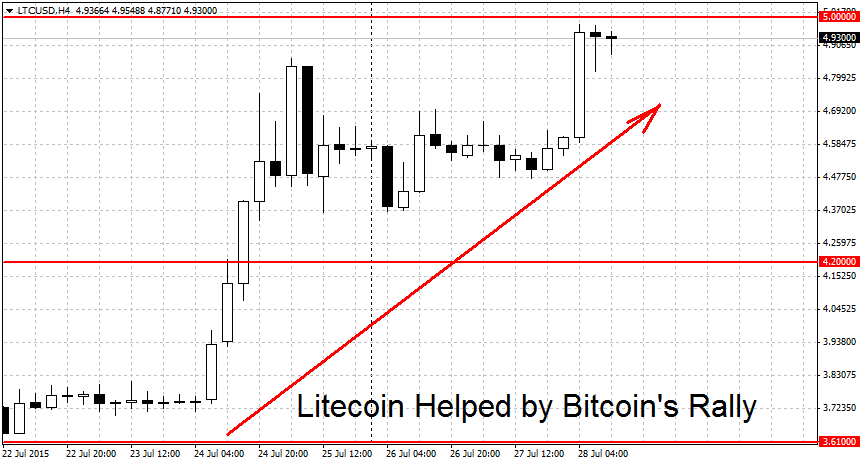
On the lower end, some support is clustered near $4.30/$4.40 dollars. This is followed by another weak support at the round $4 mark and the $3.61 swing low. To start a new downtrend, the bears will need to break below the $3.18 lows. For now, until price reaches some of the critical levels, the sensible approach seems to be ”wait and see.”
FXOpen offers the world's most popular cryptocurrency CFDs*, including Bitcoin and Ethereum. Floating spreads, 1:2 leverage — at your service. Open your trading account now or learn more about crypto CFD trading with FXOpen.
*At FXOpen UK and FXOpen AU, Cryptocurrency CFDs are only available for trading by those clients categorised as Professional clients under FCA Rules and Professional clients under ASIC Rules respectively. They are not available for trading by Retail clients.
This article represents the opinion of the Companies operating under the FXOpen brand only. It is not to be construed as an offer, solicitation, or recommendation with respect to products and services provided by the Companies operating under the FXOpen brand, nor is it to be considered financial advice.
Stay ahead of the market!
Subscribe now to our mailing list and receive the latest market news and insights delivered directly to your inbox.

Latest articles

Weekly Market Wrap With Gary Thomson: Nasdaq, EUR/USD, USD/CHF, Brent Crude Oil, Googl Shares
Get the latest scoop on the week's hottest headlines, all in one convenient video. Join Gary Thomson, the COO of FXOpen UK, as he breaks down the most significant news reports and shares his expert insights.
- Nasdaq Composite: Worst Session

Analysis of AUD/USD: Exchange Rate Falls to Early May Low
As indicated by the 4-hour AUD/USD chart today:
→ the rate fell below 0.652, a level last seen on May 2;
→ the RSI indicator dropped below 15, a level last seen during the panic over the spread of COVID-19

Analysis of AMZN Stock: Price at 1.5-Month Low
As shown in the AMZN chart, the stock price dropped below:
→ the psychological level of $180;
→ the mid-June interim low.
The last time AMZN traded below $180 was in early June.
Thus, AMZN has faced sell-offs, similar to other tech