


Bitcoin Rally Continues, Litecoin Flat
FXOpen
The slow Bitcoin recovery continues with the market making new highs. We hit $1,085 recently on FXOpen. Meanwhile, Litecoin continues to struggle with prices only up by 3.5 cents or just under 1 percent.
Bitcoin Recovery Continues
The recovery in BTC prices continues for another week. We are currently quoted at $1,085, over $93 dollars higher compared to the price noted last Tuesday. This is a gain of 9.4% in percentage terms. As you can see on the chart below, we’ve been in an almost constant uptrend since the lows at $913 over one month ago.
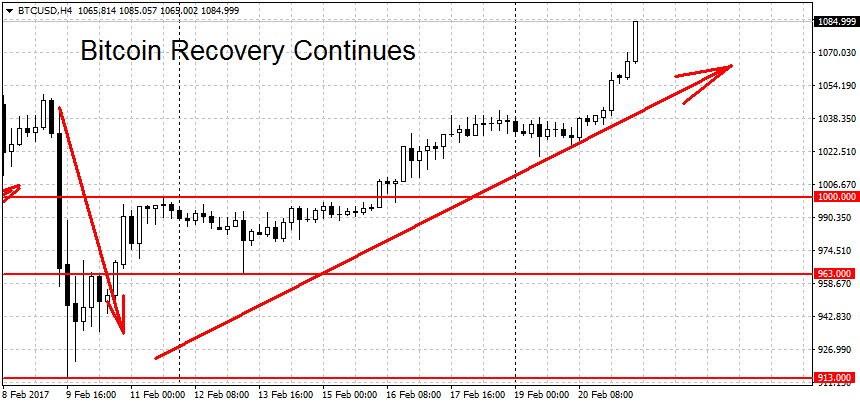
To end the current rally, the bears will have to push prices below the $963 swing low. Above here the $1,000 round figure could provide some support as well. Below $963 the next notable level is at $913 dollars swing low. On the upside, there are no major resistance levels until the multi-year high at $1,096 on FXOpen and $1,160/65 on other USD exchanges.
Similarly to the daily charts, on the longer-term charts (weekly and monthly) bitcoin remains in a bullish trend as well.
There’s not much on the news front this week. The decision for the bitcoin ETF hasn’t been delivered yet. The final deadline is on March 11th but the SEC decision will likely come before this time. Some prediction markets put the odds for ETF approval in the 20-30% range. In the case of a negative result, prices would fall, so the bulls need to be aware of this potential ‘gray swan’ and plan for it.
Litecoin Trades Flat
There hasn’t been much progress on the Litecoin front since it began a new downtrend back on February 9th. We are now quoted at $3.735, up by only 3.5 cents compared to one week ago. In percentage terms, this is a move of 0.95%.
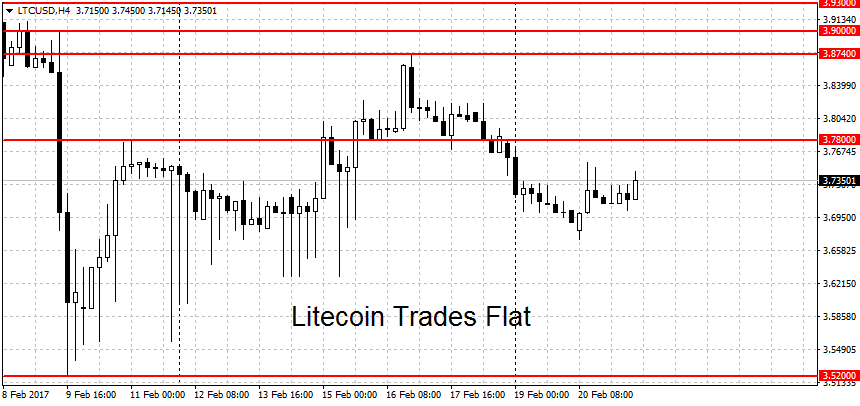
Despite the lack of progress, we’re still in a bearish trend here. To end it, the bulls will have to push LTC/USD back above the $3.874 swing high. Above here we have several weaker resistance levels at $3.90, $3.93 and the $4 round figure. A new rally requires a breakout above $4.02 dollars per coin.
On the other end, the first major support is at $3.52. This is closely followed by several potential support levels at $3.40, $3.36, $3.31 and $3.22 dollars. A clearing of this support area could lead to more losses. On the longer-term charts, Litecoin continues to be range-bound.
FXOpen offers the world's most popular cryptocurrency CFDs*, including Bitcoin and Ethereum. Floating spreads, 1:2 leverage — at your service (additional fees may apply). Open your trading account now or learn more about crypto CFD trading with FXOpen.
*Important: At FXOpen UK, Cryptocurrency trading via CFDs is only available to our Professional clients. They are not available for trading by Retail clients. To find out more information about how this may affect you, please get in touch with our team.
This article represents the opinion of the Companies operating under the FXOpen brand only. It is not to be construed as an offer, solicitation, or recommendation with respect to products and services provided by the Companies operating under the FXOpen brand, nor is it to be considered financial advice.
Stay ahead of the market!
Subscribe now to our mailing list and receive the latest market news and insights delivered directly to your inbox.


Latest articles

DAX 40: consolidation amid technology sell-off
A wave of selling in the technology sector that emerged earlier this week has weighed on European equities. The trigger was investor concern over the profitability of large-scale debt-funded investments by major US tech companies in AI infrastructure. The Nasdaq

Euro Hits Fresh Yearly Lows Amid Dovish ECB Signals
The euro remains under pressure following weak macroeconomic data from the euro area and fresh signals that the European Central Bank is prepared to maintain a more accommodative monetary policy stance. Data released yesterday pointed to a deterioration in business

Pound at Key Levels: Markets Assess Impact of Political Uncertainty in the UK
The British pound remains under pressure following increased political uncertainty in the United Kingdom triggered by the Prime Minister’s resignation. Investors are assessing potential shifts in the political and economic policy outlook after the head of government stepped down,