


Bitcoin Rally Continues
FXOpen
The CME/fork inspired rally in bitcoin continues. Its little brother Litecoin is not participating this time around, however.
Bitcoin Rally Continues
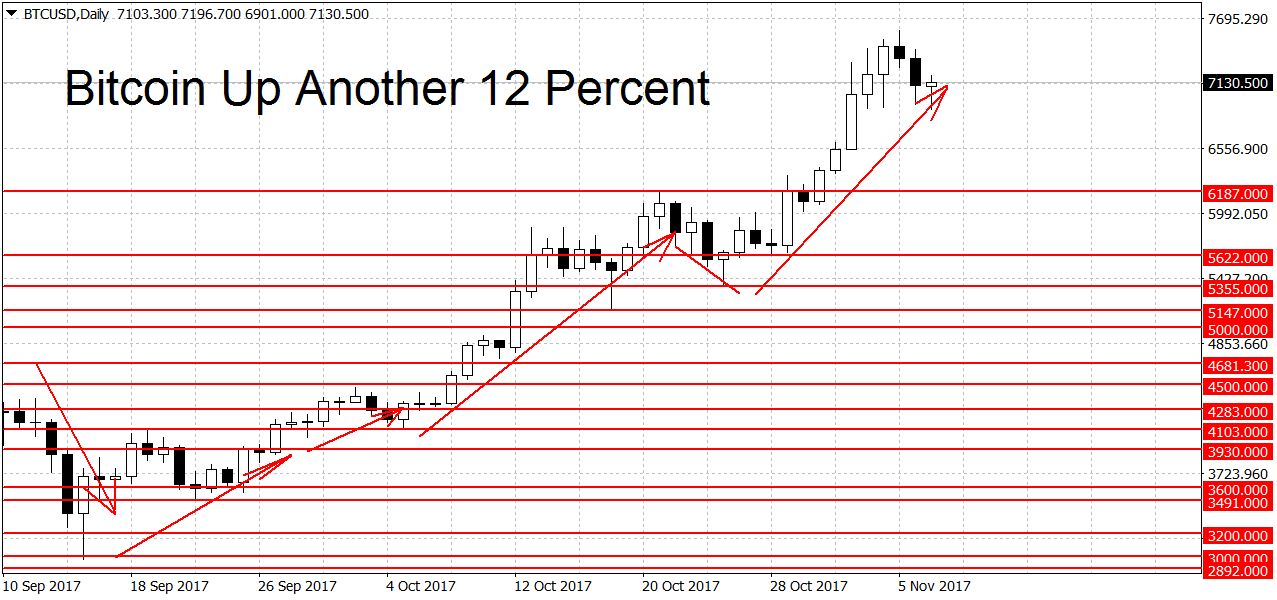
Bitcoin is currently quoted at $7,130 dollars per coin, up by close to 12 percent since last Tuesday. As reported back then, the Chicago Mercantile Exchange announced that they will offer BTC futures by the end of this year, pending regulatory approval. This, along with the coming bitcoin fork (Segwit2x) on November 16th, is pushing prices higher.
The gains in BTC and the selling of alts at the same time suggests that traders are again positioning to take advantage of what they perceive as ‘free money’. Unlike previous forks, however, during this one, both sides refuse to add replay protection. This means that it will be harder to safely split the two chains and sell the ‘losing’ fork.
Right now the future segwit2x coins (BT2) are trading at 0.12 BTC on Okex. However note that in case of no fork, the terms suggest that BT2 will expire worthlessly. This includes the scenario where Core developers ‘surrender’ and decide to implement 2mb blocks themselves. So a bet on BT2 on Okex is a bet on a fork occurring, in addition to it being a bet on segwit2x ‘winning’. Currently, around 83% of mining hash is still signalling support for segwit2x.
Back to technicals! The rally in BTC/USD continues and we are trading 11.7 percent higher compared to seven days ago. We need to see a break of the $5,622 swing low before we can call an end to the bullish trend. A new downtrend may commence if prices fall below the $5,355 swing low. On the longer-term weekly and monthly charts bitcoin is looking bullish as well.
Litecoin Doesn’t Follow Big Brother
Like we saw during previous pre-fork periods, LTC/USD refuses to follow BTC/USD higher. Traders are liquidating altcoins in order to buy BTC for the upcoming fork. The altcoin is quoted at $55.12 dollars right now, down by 51 cents (-0.7 %) since our last update. Note that the fork is not a certainty and there are non-negligible odds that it may not occur if either side ‘surrenders’. No fork could lead to unwinding of previous trades and a recovery in altcoins.
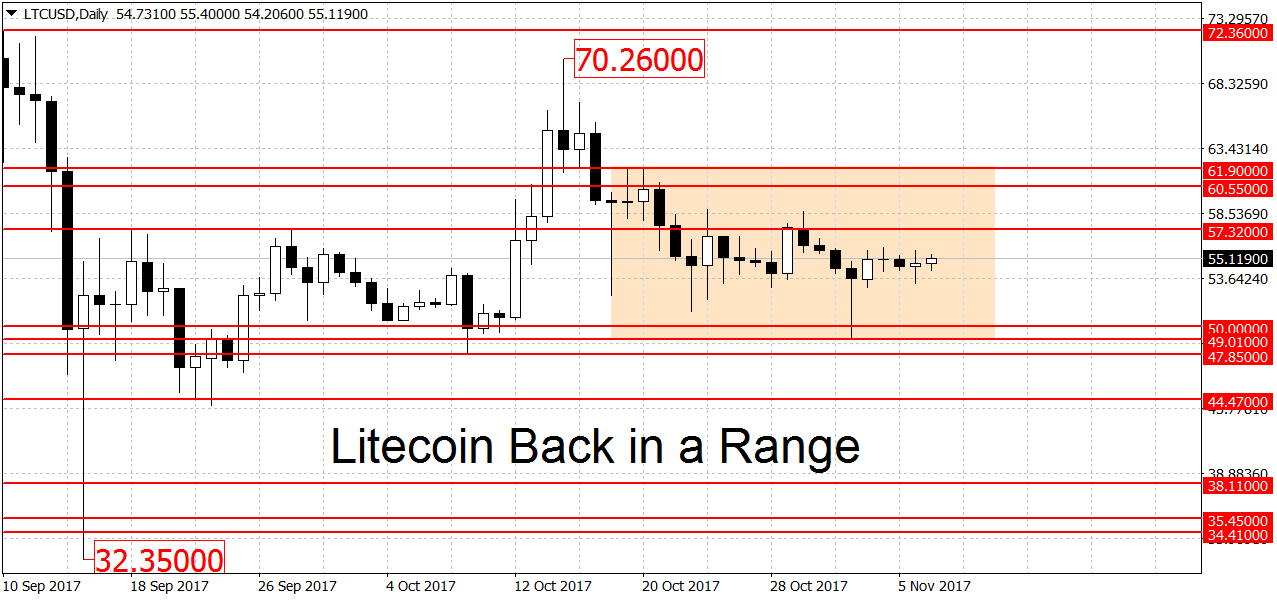
Litecoin is now in a range on the daily charts. A new uptrend requires a breakout above the $61.90 swing high. A new downtrend needs a decisive clearing of the support area around the $50 round figure, which now includes the most recent swing low at $49.01. Similarly to the daily, the weekly is range-bound but the monthly is keeping the bullish bias.
FXOpen offers the world's most popular cryptocurrency CFDs*, including Bitcoin and Ethereum. Floating spreads, 1:2 leverage — at your service (additional fees may apply). Open your trading account now or learn more about crypto CFD trading with FXOpen.
*Important: At FXOpen UK, Cryptocurrency trading via CFDs is only available to our Professional clients. They are not available for trading by Retail clients. To find out more information about how this may affect you, please get in touch with our team.
This article represents the opinion of the Companies operating under the FXOpen brand only. It is not to be construed as an offer, solicitation, or recommendation with respect to products and services provided by the Companies operating under the FXOpen brand, nor is it to be considered financial advice.
Stay ahead of the market!
Subscribe now to our mailing list and receive the latest market news and insights delivered directly to your inbox.


Latest articles

Apple: Earnings Day Above the Activity Zone
On 30 April, after the market close, Apple Inc. will release its financial results for the second quarter of fiscal 2026. The consensus forecast, based on estimates from 31 analysts, points to revenue of around $109.7 billion, with expected

USD/JPY and USD/CHF Near Key Levels: The Dollar Supported by the Fed
The US dollar continues to trend upwards following the Federal Reserve meeting, drawing support from the regulator’s moderately hawkish stance and comments by Jerome Powell. Markets interpret the Fed’s rhetoric as a signal that restrictive policy is likely

EUR/USD and GBP/USD consolidate ahead of the Fed decision
European currencies are showing subdued dynamics, entering a consolidation phase following their previous advance. Earlier, EUR/USD and GBP/USD broke out of their ranges and strengthened; however, the subsequent correction has led both pairs to retest the previously breached