


FXOpen
The rally in bitcoin prices ended last Saturday after prices decisively broke below the important $270 support level. While the initial push took us to a low of $252 dollars per coin, we have since bounced back somewhat. Meanwhile the rest of the cryptomarket is more or else stable as well. For example Litecoin has been trading flat for the past six days hovering right below the $4 figure.
Bitcoin Rally Ends
The bitcoin rally ended on August 8th with a break of $270 that took out $265 one hour later. In the next 10 hours, BTC/USD was down by $13 dollars to $252 flat, a decline of 4.9 percent. Bitcoin has since rebounded and is currently quoted at $261.95, after trading as high as $269.26 this morning.
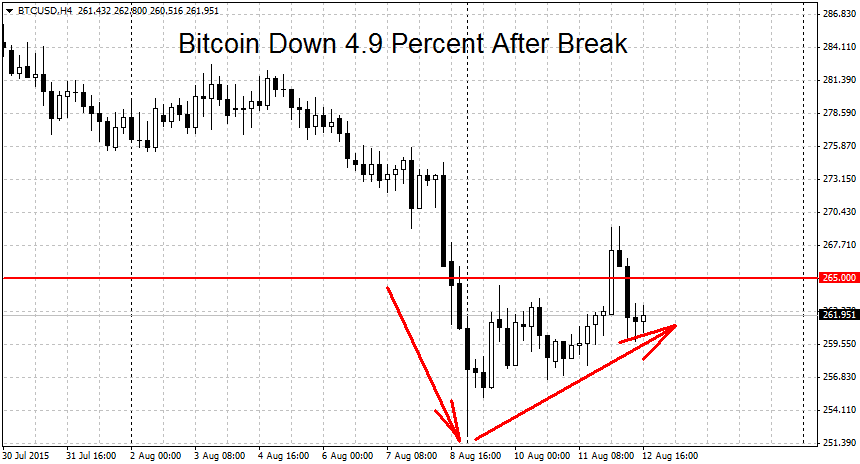
The rebound shows that it’s hard for prices to switch from uptrend to downtrend mode right away. While BTC hit new monthly lows on August 9th, follow-through lacked. Everyone’s favorite cryptocurrency may need to break $250 dollars per coin to start a new downtrend in prices. This figure is important because it was the starting point for bitcoin’s latest rally.
Below this level, we find weaker support at $240 and $230 dollars per coin. A more important support can be found lower near $210 dollars. This was a double bottom formation that marked the lows for the past six months. If we exclude the short 2 minute spike on July 18th, this level hasn’t been broken since. If the bears manage to push prices below $210, the losses could accelerate.
Litecoin Waits for Next Move
Litecoin traders are waiting for its next move. The LTC rally ended with a blowout top on July 10th and prices have kept a downward bias since. But the losses have been moderate and haven’t sent Litecoin into a new downtrend yet. We are currently quoted at $3.92 dollars per coin, barely changed compared to a close of $3.94 on August 8th.
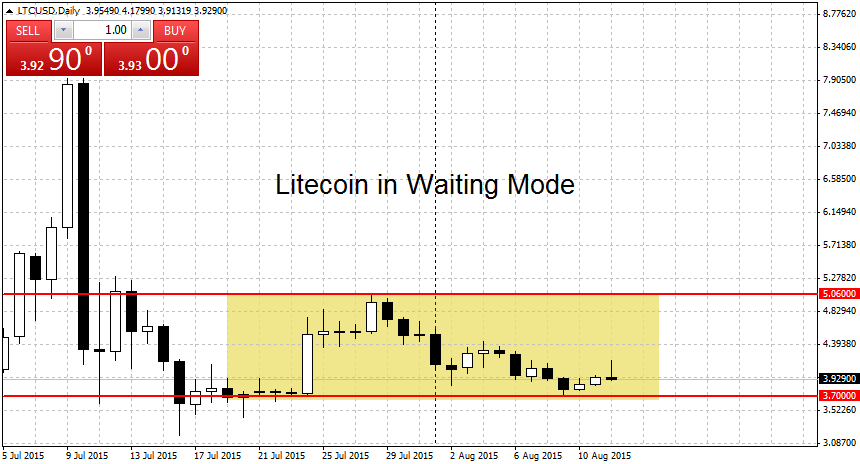
What’s next for Litecoin? The altcoin has been trading range-bound, roughly between $3.70 and $5 dollars. A break below $3.70 or above $5.06 may lead to a sustainable downtrend/uptrend. More caution should be exercised on the long side however. Litecoin ended a major rally last month with a crash. Refueling this rally will be hard to do, especially when we have big brother bitcoin making new lows as well.
Below $3.70 notable support levels include $3.50, $3.43 and $3.18 dollars per coin. The first two of these are weak but the $3.18 mark is important support. It’s a former swing high that held up the rally in June for several days. It’s validity was confirmed in July when prices rebounded after having dipped to a low of $3.1840 in the aftermath of the crash. A decisive break below here could lead to more losses.
FXOpen offers the world's most popular cryptocurrency CFDs*, including Bitcoin and Ethereum. Floating spreads, 1:2 leverage — at your service. Open your trading account now or learn more about crypto CFD trading with FXOpen.
*At FXOpen UK and FXOpen AU, Cryptocurrency CFDs are only available for trading by those clients categorised as Professional clients under FCA Rules and Professional clients under ASIC Rules respectively. They are not available for trading by Retail clients.
This article represents the opinion of the Companies operating under the FXOpen brand only. It is not to be construed as an offer, solicitation, or recommendation with respect to products and services provided by the Companies operating under the FXOpen brand, nor is it to be considered financial advice.
Stay ahead of the market!
Subscribe now to our mailing list and receive the latest market news and insights delivered directly to your inbox.

Latest articles

Weekly Market Wrap With Gary Thomson: Nasdaq, EUR/USD, USD/CHF, Brent Crude Oil, Googl Shares
Get the latest scoop on the week's hottest headlines, all in one convenient video. Join Gary Thomson, the COO of FXOpen UK, as he breaks down the most significant news reports and shares his expert insights.
- Nasdaq Composite: Worst Session

Analysis of AUD/USD: Exchange Rate Falls to Early May Low
As indicated by the 4-hour AUD/USD chart today:
→ the rate fell below 0.652, a level last seen on May 2;
→ the RSI indicator dropped below 15, a level last seen during the panic over the spread of COVID-19

Analysis of AMZN Stock: Price at 1.5-Month Low
As shown in the AMZN chart, the stock price dropped below:
→ the psychological level of $180;
→ the mid-June interim low.
The last time AMZN traded below $180 was in early June.
Thus, AMZN has faced sell-offs, similar to other tech