


Bitcoin Rally Ends, Litecoin Still Up
FXOpen
The slow bitcoin rally has finally ended. The sell-off last Thursday and Friday pushed prices down to the $435 level. Its little brother Litecoin is still in its own uptrend after bouncing strongly at the $3.78 dollars figure.
Bitcoin Uptrend Ends
The long but slow bitcoin rally is finally over. On Thursday prices broke below the lower bound of the triangle pattern. On Friday a low of $434.86 was hit.
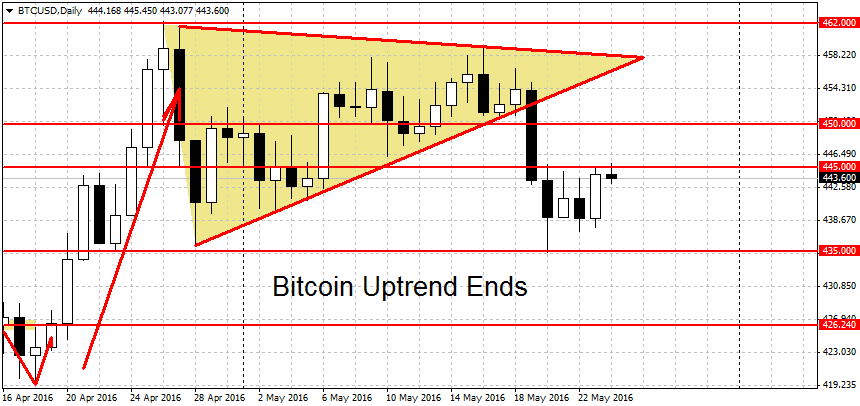
The $435 figure was noted in our previous article as a potential downtrend starting point. Because we didn’t get a decisive break of the level but a shallow move below, the short-term picture remains neutral. The medium-term trend is still up but the long-term trend for BTC is neutral as well.
What’s next for bitcoin? The two major points of interest are $435 on the downside and $465 on the upside. A clean break below $435 could start a new short-term downtrend. Support below here can be found at $426 dollars (the breakout point for the previous rally) followed by the $412 swing low and the round $400 figure.
On the upside, a breakout above the $462-$465 resistance area would resume the BTC rally. The major resistance for bitcoin is the round $500 figure. This was last year’s high for BTC/USD on most exchanges. A decisive breakout above here could intensify the gains.
Litecoin Still in Rally Mode
Alternative crypto-currency Litecoin is still in rally mode. The bitcoin selling lead to a sympathy move lower in LTC/USD. On Fxopen a low of $3.78 dollars was hit last Friday. This is exactly the level we noted last week as a potential trend stopper. Luckily for the bulls, right at this figure the sell-off ended and a recovery rally took prices to a high of $3.98 dollars on Saturday. We’re currently quoted at $3.95 dollars per coin.
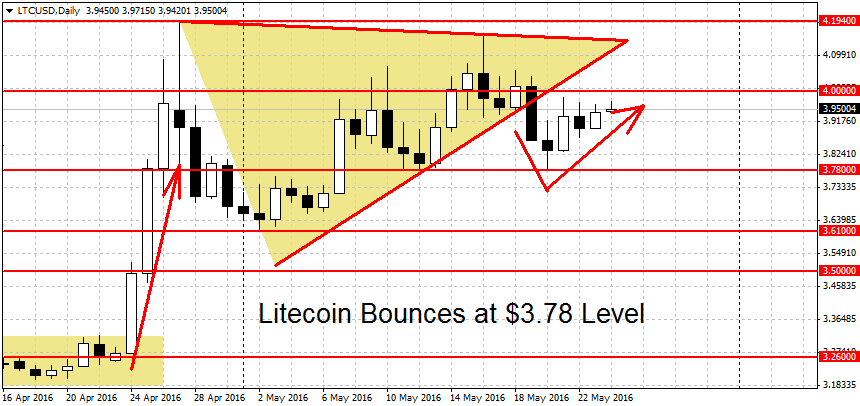
The technical picture is mostly unchanged for LTC. A decisive break below $3.78 would end the current rally. Both the short-term and medium term trends are up while the long-term trend is still neutral.
A breakout above the highs of ascending triangle at at $4.194 would resume the momentum move higher. Above here we have resistance at the $4.50 figure, followed by the $4.85 swing high and the round figure at $5 dollars. The next potential resistance level is at $8.64 dollars. This was the 2015 high for Litecoin. As we’ve written previously, due to the large price gap between $5 and $8.64 dollars, resistance levels are likely to emerge in between. Potential candidates include the round figures at $6, $7 and $8 dollars, as well as the 50 cents figures at $6.50 and $7.50 dollars per coin.
FXOpen offers the world's most popular cryptocurrency CFDs*, including Bitcoin and Ethereum. Floating spreads, 1:2 leverage — at your service (additional fees may apply). Open your trading account now or learn more about crypto CFD trading with FXOpen.
*Important: At FXOpen UK, Cryptocurrency trading via CFDs is only available to our Professional clients. They are not available for trading by Retail clients. To find out more information about how this may affect you, please get in touch with our team.
This article represents the opinion of the Companies operating under the FXOpen brand only. It is not to be construed as an offer, solicitation, or recommendation with respect to products and services provided by the Companies operating under the FXOpen brand, nor is it to be considered financial advice.
Stay ahead of the market!
Subscribe now to our mailing list and receive the latest market news and insights delivered directly to your inbox.


Latest articles

NZD/USD: Inflation Surge Meets Strong US Dollar Pressure
On 21 July, Stats NZ reported an acceleration in inflation: the Consumer Price Index rose 1.5% in the second quarter, while the annual inflation rate climbed to 4.1%, its highest level in more than two years and slightly

Weekly Market Insights with Gary Thomson: The Week of Central Banks and Earnings
In this video, we’ll explore the key economic events and market trends, shaping the financial landscape. Get ready for insights into financial markets to help you navigate the week ahead. Let’s dive in!
In this episode of Market

Intel at a Crossroads: Earnings Beat Meets Technical Resistance
Intel has just delivered its strongest quarter in over fifteen years, and the market reaction says it all. Q2 2026 revenue surged 25% year-over-year to $16.1 billion, crushing the consensus estimate of $14.42 billion, while adjusted EPS of