


Bitcoin Rally Hangs by a Thread After Crash
FXOpen
Bitcoin flash-crashed 30 percent on a cleared orderbook. Meanwhile alternative cryptocurrency Litecoin stayed mostly flat since last Friday. But as usual let’s start with big brother first.
Bitcoin Flash-Crashes 30 Percent
Bitcoin flash-crashed close to 30 percent in 2 minutes. The crash happened due to a large sell order on the BTC-E exchange. This market order cleared the entire buy side all the way down to $194 dollars per coin.It only took 2 minutes to go from $276 to $194 dollars, a fall of 30 percent. Then the arbitrage bots took advantage of the opportunity and bought up the cheap BTC-E coins. In 5 minutes, prices were almost back to where they traded before the crash. Because FXOpen sources its data from BTC-E, we saw an identical decline on its platform as well.
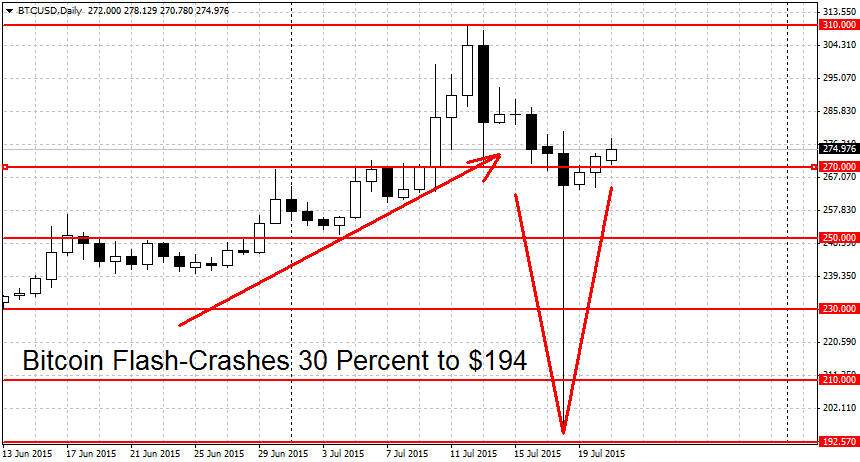
The crash should be a cause for worry to the bulls. While the primary cause was low liquidity on one exchange (likely due to the summer season), it shows that the path of least resistance is to the downside. Still, the crash hasn’t altered the current bitcoin uptrend because other major exchanges stayed flat during this event. To end the current rally, the bears will need to make a decisive push below the important support at $265/$270 dollars. Due to low liquidity during the summer months, it’s better if the move lower is confirmed with other exchanges like OKCoin and BitStamp.
While the trend is up, the momentum is non-existent. As can we seen on the chart above, BTC/USD managed to string together three winning days after the crash. But the gains are small, $3 dollars, $4 dollars and again $3 today, for a total of $10 dollars or 3.7 percent. During bitcoin’s breakout stage just 10 days ago we saw bigger gains on a daily basis. To restart the lost momentum, we would need to see a breakout above the yearly high at $318 dollars.
Litecoin Flat Since Friday
Alternative cryptocurrency Litecoin stayed mostly flat since last Friday. The day before that however, the coin lost 56 cents (14 percent) to close the day at $3.61 dollars. This confirmed our view that the rally in LTC/USD is now over. We are currently quoted at $3.79 dollars, not far from Thursday’s close.
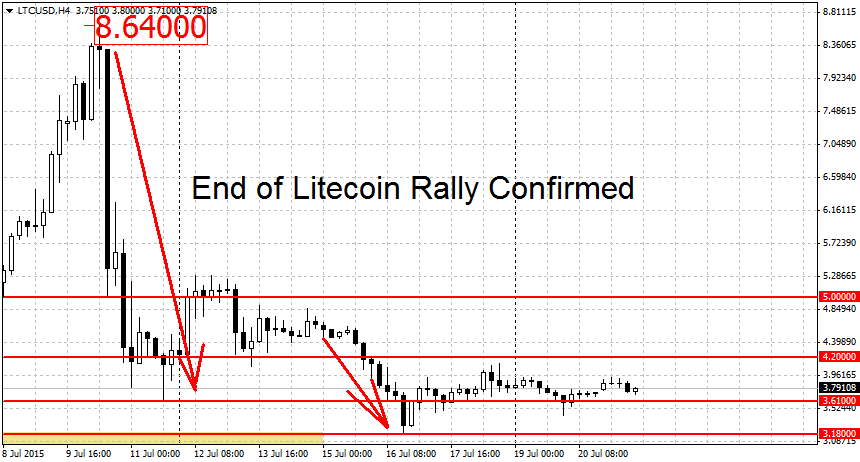
A break below this month’s low at $3.18 dollars would technically start a new downtrend for LTC. But caution is advised. Strong trends rarely die without a fight. It’s also fairly unusual for prices to just switch from an uptrend right into a downtrend. Ideally we would want to see some consolidation before a leg lower commences. On the higher end, the bulls will need to push prices above the $8.64 high to restart the rally.
FXOpen offers the world's most popular cryptocurrency CFDs*, including Bitcoin and Ethereum. Floating spreads, 1:2 leverage — at your service (additional fees may apply). Open your trading account now or learn more about crypto CFD trading with FXOpen.
*Important: At FXOpen UK, Cryptocurrency trading via CFDs is only available to our Professional clients. They are not available for trading by Retail clients. To find out more information about how this may affect you, please get in touch with our team.
This article represents the opinion of the Companies operating under the FXOpen brand only. It is not to be construed as an offer, solicitation, or recommendation with respect to products and services provided by the Companies operating under the FXOpen brand, nor is it to be considered financial advice.
Stay ahead of the market!
Subscribe now to our mailing list and receive the latest market news and insights delivered directly to your inbox.


Latest articles

EUR/USD Eyes Gains As USD/CHF Weakness Deepens Again
EUR/USD started a fresh increase above 1.1700 and 1.1720. USD/CHF declined further and is now struggling below 0.7835.
Important Takeaways for EUR/USD and USD/CHF Analysis Today
· The Euro started a decent increase from

Apple: Earnings Day Above the Activity Zone
On 30 April, after the market close, Apple Inc. will release its financial results for the second quarter of fiscal 2026. The consensus forecast, based on estimates from 31 analysts, points to revenue of around $109.7 billion, with expected

USD/JPY and USD/CHF Near Key Levels: The Dollar Supported by the Fed
The US dollar continues to trend upwards following the Federal Reserve meeting, drawing support from the regulator’s moderately hawkish stance and comments by Jerome Powell. Markets interpret the Fed’s rhetoric as a signal that restrictive policy is likely